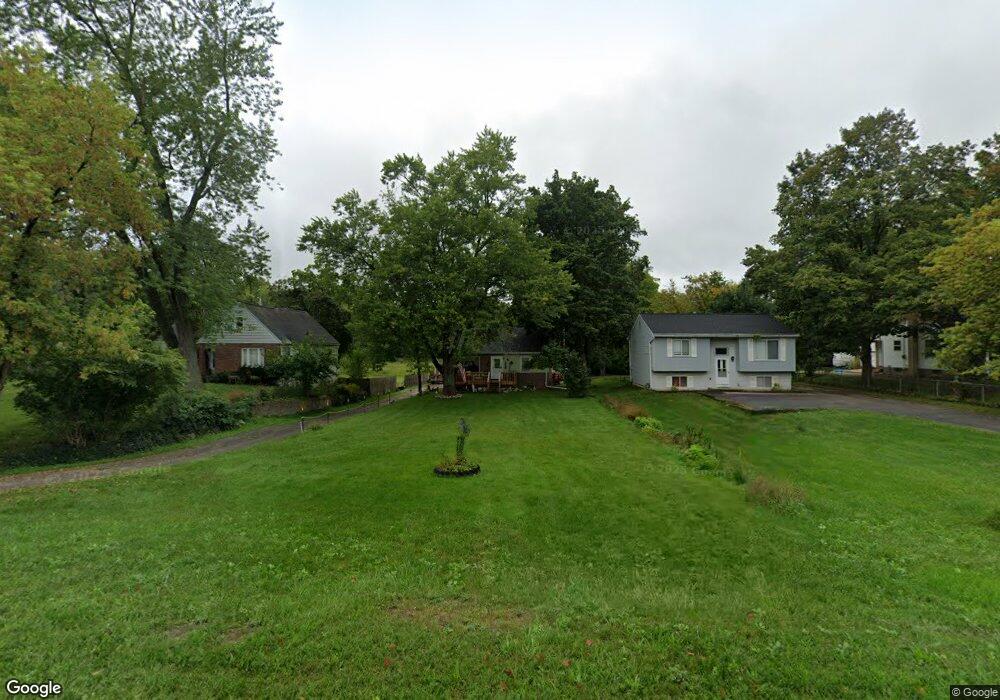
1103 N Waverly Rd Lansing, MI 48917
Estimated Value: $90,566 - $197,000
3
Beds
1
Bath
2,437
Sq Ft
$65/Sq Ft
Est. Value
About This Home
This home is located at 1103 N Waverly Rd, Lansing, MI 48917 and is currently estimated at $158,142, approximately $64 per square foot. 1103 N Waverly Rd is a home located in Eaton County with nearby schools including Waverly Senior High School, Windemere Park Charter Academy, and St. Gerard Elementary School.
Ownership History
Date
Name
Owned For
Owner Type
Purchase Details
Closed on
Jun 9, 2025
Sold by
Jeffrey T Bland Trust and Bland Jeffrey T
Bought by
Wilson Michelle Rose and Ridenour Kenneth E
Current Estimated Value
Home Financials for this Owner
Home Financials are based on the most recent Mortgage that was taken out on this home.
Original Mortgage
$39,000
Outstanding Balance
$38,900
Interest Rate
6.81%
Mortgage Type
New Conventional
Estimated Equity
$119,242
Purchase Details
Closed on
Oct 8, 2020
Sold by
Bland Jeffrey T and The Jeffrey T Bland Trust
Bought by
Ridenour Kenneth E and Wilson Michelle Rose
Purchase Details
Closed on
Oct 16, 2018
Sold by
Bland Jeffrey T and Estate Of Virginia Lucrecia Bl
Bought by
Bland Jeffrey T
Purchase Details
Closed on
Oct 31, 2011
Sold by
Secretary Of Housing & Urban Development
Bought by
Bland Virginia
Purchase Details
Closed on
Mar 31, 2011
Sold by
Chase Home Finance Llc
Bought by
The Secretary Of Housing & Urban Develop
Purchase Details
Closed on
Feb 17, 2011
Sold by
Snell Frank N
Bought by
Chase Home Finance Llc
Purchase Details
Closed on
Aug 8, 2003
Sold by
Lofton Mary E
Bought by
Snell Frank N
Home Financials for this Owner
Home Financials are based on the most recent Mortgage that was taken out on this home.
Original Mortgage
$110,311
Interest Rate
5.62%
Mortgage Type
FHA
Create a Home Valuation Report for This Property
The Home Valuation Report is an in-depth analysis detailing your home's value as well as a comparison with similar homes in the area
Home Values in the Area
Average Home Value in this Area
Purchase History
| Date | Buyer | Sale Price | Title Company |
|---|---|---|---|
| Wilson Michelle Rose | $75,000 | None Listed On Document | |
| Ridenour Kenneth E | -- | None Available | |
| The Jeffrey T Bland Trust | -- | None Available | |
| Bland Jeffrey T | -- | None Available | |
| Bland Virginia | $26,709 | None Available | |
| The Secretary Of Housing & Urban Develop | -- | None Available | |
| Chase Home Finance Llc | $126,361 | None Available | |
| Snell Frank N | $111,500 | Metropolitan Title Okemos Se |
Source: Public Records
Mortgage History
| Date | Status | Borrower | Loan Amount |
|---|---|---|---|
| Open | Wilson Michelle Rose | $39,000 | |
| Previous Owner | Snell Frank N | $110,311 |
Source: Public Records
Tax History
| Year | Tax Paid | Tax Assessment Tax Assessment Total Assessment is a certain percentage of the fair market value that is determined by local assessors to be the total taxable value of land and additions on the property. | Land | Improvement |
|---|---|---|---|---|
| 2025 | $2,051 | $70,900 | $0 | $0 |
| 2024 | $1,213 | $66,300 | $0 | $0 |
| 2023 | $1,166 | $62,300 | $0 | $0 |
| 2022 | $1,786 | $43,700 | $0 | $0 |
| 2021 | $1,727 | $40,900 | $0 | $0 |
| 2020 | $2,044 | $38,000 | $0 | $0 |
| 2019 | $2,162 | $37,128 | $0 | $0 |
| 2018 | $2,150 | $37,000 | $0 | $0 |
| 2017 | $2,109 | $36,900 | $0 | $0 |
| 2016 | -- | $36,100 | $0 | $0 |
| 2015 | -- | $35,700 | $0 | $0 |
| 2014 | -- | $35,300 | $0 | $0 |
| 2013 | -- | $35,200 | $0 | $0 |
Source: Public Records
Map
Nearby Homes
- 1222 Ravenswood Dr
- 1930 Briarwood Dr
- 3423 Upton Rd
- 1115 Boynton Dr
- 1805 Boynton Dr
- 0000 N Dibble Ave
- 1015 Westfield Rd
- 410 Renker Rd
- 3003 Timber Dr
- 321 Renker Rd
- 0 San Gabriel
- 807 Maycroft Rd
- 2817 W Willow St
- 4908 Applewood Dr
- 415 Winifred Ave
- 1920 Byrnes Rd
- 1031 Mall Dr E
- 401 Richard Ave
- 215 Winifred Ave Unit A & B
- 2111 Northwest Ave
- 1105 N Waverly Rd
- 1025 N Waverly Rd
- 1111 N Waverly Rd
- 1017 N Waverly Rd
- 1117 N Waverly Rd
- 1009 N Waverly Rd
- 1106 N Waverly Rd
- 1010 N Waverly Rd
- 1121 N Waverly Rd
- 1108 N Waverly Rd
- 1002 N Waverly Rd
- 1116 N Waverly Rd
- 1129 N Waverly Rd
- 933 N Waverly Rd
- 934 N Waverly Rd
- 3810 Macon Ave
- 1015 Pendleton Dr
- 1019 Pendleton Dr
- 1122 N Waverly Rd
- 1009 Pendleton Dr
Your Personal Tour Guide
Ask me questions while you tour the home.