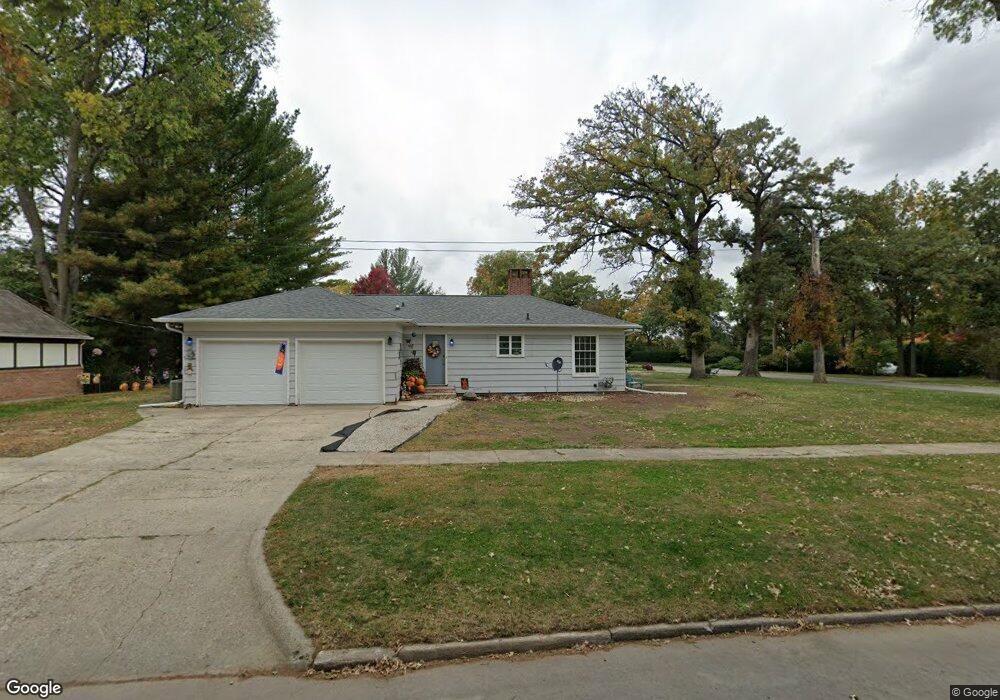
1103 S 5th Ave W Newton, IA 50208
Estimated Value: $299,000 - $331,000
3
Beds
2
Baths
2,119
Sq Ft
$146/Sq Ft
Est. Value
About This Home
This home is located at 1103 S 5th Ave W, Newton, IA 50208 and is currently estimated at $309,964, approximately $146 per square foot. 1103 S 5th Ave W is a home located in Jasper County with nearby schools including Thomas Jefferson Elementary School, Woodrow Wilson Elementary School, and Berg Middle School.
Ownership History
Date
Name
Owned For
Owner Type
Purchase Details
Closed on
Aug 30, 2022
Sold by
Farrell Properties Inc
Bought by
Sikes Robert E and Sikes Ginger A
Current Estimated Value
Home Financials for this Owner
Home Financials are based on the most recent Mortgage that was taken out on this home.
Original Mortgage
$212,430
Outstanding Balance
$203,415
Interest Rate
5.54%
Mortgage Type
New Conventional
Estimated Equity
$106,550
Purchase Details
Closed on
Mar 4, 2022
Sold by
Farrell Properties Inc
Bought by
Pinnacle Bank
Purchase Details
Closed on
Oct 26, 2011
Sold by
Federal Home Loan Mortgage Corporation
Bought by
Farrell Properties Inc
Home Financials for this Owner
Home Financials are based on the most recent Mortgage that was taken out on this home.
Original Mortgage
$200,000
Interest Rate
4.02%
Mortgage Type
FHA
Purchase Details
Closed on
May 19, 2011
Sold by
Halferty Roy Alan
Bought by
Federal Home Loan Mortgage Corporation
Create a Home Valuation Report for This Property
The Home Valuation Report is an in-depth analysis detailing your home's value as well as a comparison with similar homes in the area
Home Values in the Area
Average Home Value in this Area
Purchase History
| Date | Buyer | Sale Price | Title Company |
|---|---|---|---|
| Sikes Robert E | $218,625 | -- | |
| Pinnacle Bank | -- | None Listed On Document | |
| Farrell Properties Inc | -- | None Available | |
| Federal Home Loan Mortgage Corporation | $125,721 | None Available |
Source: Public Records
Mortgage History
| Date | Status | Borrower | Loan Amount |
|---|---|---|---|
| Open | Sikes Robert E | $212,430 | |
| Previous Owner | Farrell Properties Inc | $200,000 |
Source: Public Records
Tax History Compared to Growth
Tax History
| Year | Tax Paid | Tax Assessment Tax Assessment Total Assessment is a certain percentage of the fair market value that is determined by local assessors to be the total taxable value of land and additions on the property. | Land | Improvement |
|---|---|---|---|---|
| 2025 | $5,928 | $346,180 | $56,100 | $290,080 |
| 2024 | $5,928 | $312,980 | $56,100 | $256,880 |
| 2023 | $5,896 | $312,980 | $56,100 | $256,880 |
| 2022 | $5,568 | $267,640 | $56,100 | $211,540 |
| 2021 | $6,100 | $250,310 | $56,100 | $194,210 |
| 2020 | $6,100 | $260,110 | $47,100 | $213,010 |
| 2019 | $5,400 | $223,620 | $0 | $0 |
| 2018 | $220 | $223,620 | $0 | $0 |
| 2017 | $5,278 | $223,620 | $0 | $0 |
| 2016 | $5,406 | $223,620 | $0 | $0 |
| 2015 | $5,274 | $223,620 | $0 | $0 |
| 2014 | $5,072 | $223,620 | $0 | $0 |
Source: Public Records
Map
Nearby Homes
- 8 Chancery Ct
- 726 W 9th St S
- 308 W 8th St S
- 237 W 12th St S
- 623 S 4th Ave W
- 210 W 13th St S
- 625 S 3rd Ave W
- 1221 Monroe Dr
- 1000 1st Ave W
- 1100 1st Ave W
- 723 W 6th St S
- 702 W 6th St S
- 1431 Cardinal Ridge Dr
- 303 W 5th St S
- 621 W 4th St S
- 1121 Woodland Dr
- 304 W 11th St N
- 429 1st Ave W
- 704 W 4th St S
- 420 1st Ave W
- 1105 S 5th Ave W
- 1100 S 6th Ave W
- 1017 S 5th Ave W
- 1104 S 5th Ave W
- 1110 S 6th Ave W
- 1016 S 6th Ave W
- 1013 S 5th Ave W
- 1109 S 5th Ave W
- 1018 S 5th Ave W
- 1012 S 6th Ave W
- 1112 S 6th Ave W
- 1006 S 6th Ave W
- 1107 S 6th Ave W
- 1002 S 6th Ave W
- 1119 S 6th Ave W
- 1001 S 5th Ave W
- 1017 S 6th Ave W
- 410 W 11th St S
- 1004 S 5th Ave W
- 800 W 11th St S