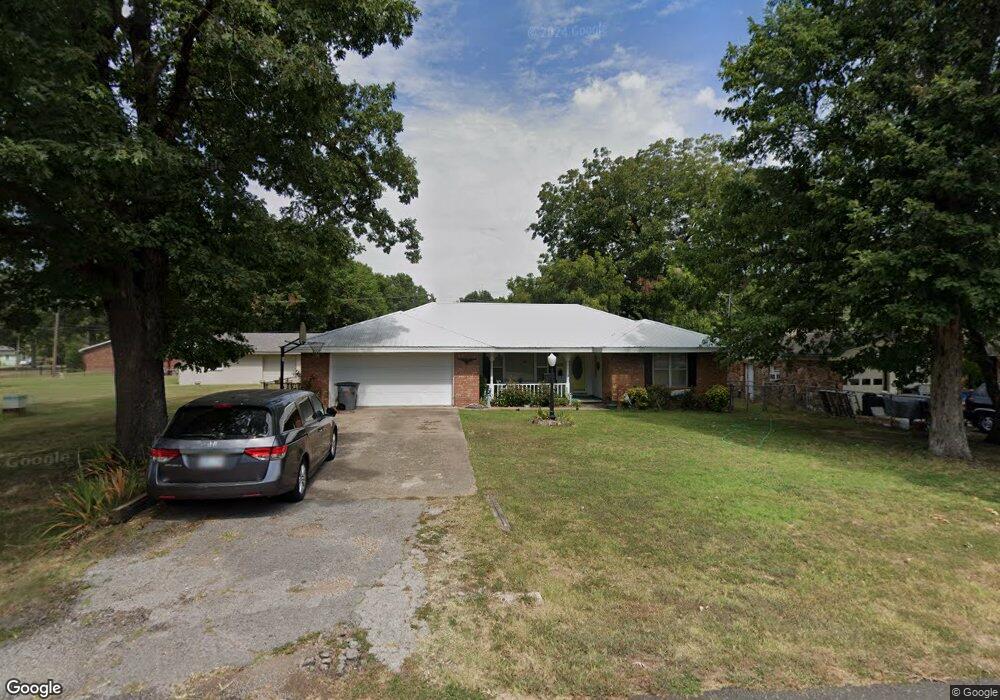
1103 SE 12th St Wagoner, OK 74467
Estimated Value: $147,581 - $187,000
--
Bed
1
Bath
1,487
Sq Ft
$117/Sq Ft
Est. Value
About This Home
This home is located at 1103 SE 12th St, Wagoner, OK 74467 and is currently estimated at $173,895, approximately $116 per square foot. 1103 SE 12th St is a home located in Wagoner County with nearby schools including Ellington Elementary School, William R. Teague Elementary School, and Wagoner Middle School.
Ownership History
Date
Name
Owned For
Owner Type
Purchase Details
Closed on
Dec 3, 2012
Sold by
The First United Methodist Church Of Wag
Bought by
Collier Cox Annie Jean
Current Estimated Value
Home Financials for this Owner
Home Financials are based on the most recent Mortgage that was taken out on this home.
Original Mortgage
$73,500
Outstanding Balance
$12,561
Interest Rate
2.73%
Mortgage Type
New Conventional
Estimated Equity
$161,334
Purchase Details
Closed on
Aug 29, 2007
Sold by
Thompson Deborah Lee and Nichols Deborah L
Bought by
Collier Annie Jean
Home Financials for this Owner
Home Financials are based on the most recent Mortgage that was taken out on this home.
Original Mortgage
$73,600
Interest Rate
6.72%
Mortgage Type
New Conventional
Purchase Details
Closed on
Sep 8, 2006
Sold by
Thompson Louis D
Bought by
Thomson Deborah Lee and Nichols Deborah L
Create a Home Valuation Report for This Property
The Home Valuation Report is an in-depth analysis detailing your home's value as well as a comparison with similar homes in the area
Home Values in the Area
Average Home Value in this Area
Purchase History
| Date | Buyer | Sale Price | Title Company |
|---|---|---|---|
| Collier Cox Annie Jean | -- | None Available | |
| Collier Annie Jean | $92,000 | Metro Abstract & Title | |
| Thomson Deborah Lee | -- | None Available |
Source: Public Records
Mortgage History
| Date | Status | Borrower | Loan Amount |
|---|---|---|---|
| Open | Collier Cox Annie Jean | $73,500 | |
| Previous Owner | Collier Annie Jean | $73,600 |
Source: Public Records
Tax History Compared to Growth
Tax History
| Year | Tax Paid | Tax Assessment Tax Assessment Total Assessment is a certain percentage of the fair market value that is determined by local assessors to be the total taxable value of land and additions on the property. | Land | Improvement |
|---|---|---|---|---|
| 2025 | $864 | $9,829 | $499 | $9,330 |
| 2024 | $864 | $9,361 | $475 | $8,886 |
| 2023 | $823 | $8,915 | $460 | $8,455 |
| 2022 | $782 | $8,491 | $443 | $8,048 |
| 2021 | $564 | $8,087 | $421 | $7,666 |
| 2020 | $577 | $8,087 | $514 | $7,573 |
| 2019 | $497 | $8,087 | $513 | $7,574 |
| 2018 | $526 | $8,087 | $528 | $7,559 |
| 2017 | $518 | $8,087 | $492 | $7,595 |
| 2016 | $504 | $8,087 | $483 | $7,604 |
| 2015 | $510 | $8,087 | $655 | $7,432 |
| 2014 | $674 | $10,017 | $1,120 | $8,897 |
Source: Public Records
Map
Nearby Homes
- 1209 S Powell Ave
- 1304 SE 12th St
- 1305 SE 15th St
- 908 S Powell Ave
- 808 SE 15th St
- 0 SE 15th St
- 1014 SE 3rd St
- 0 Oklahoma 16
- 806 E Church St
- 705 E Church St
- 703 E Church St
- 306 S State St
- 307 S Lee Ave
- 0 Martin Luther King Blvd
- 0 SW 15th St
- 1406 S Polk Ave
- 0 S Polk Ave
- 907 NE 4th St
- 701 NE 4th St
- 1406 S Filmore Ave
- 1105 SE 12th St
- 1101 SE 12th St
- 1104 SE 11th St
- 1106 SE 11th St
- 1302 S Mckinley Ave
- 1201 SE 12th St
- 1102 SE 12th St
- 1304 S Mckinley Ave
- 1203 S Mckinley Ave
- 1205 SE 12th St
- 1007 SE 12th St
- 1201 S Mckinley Ave
- 1202 SE 12th St
- 1306 S Mckinley Ave
- 1006 SE 11th St
- 1005 SE 12th St
- 1105 SE 11th St
- 1103 SE 11th St
- 1107 SE 11th St
- 1204 SE 12th St