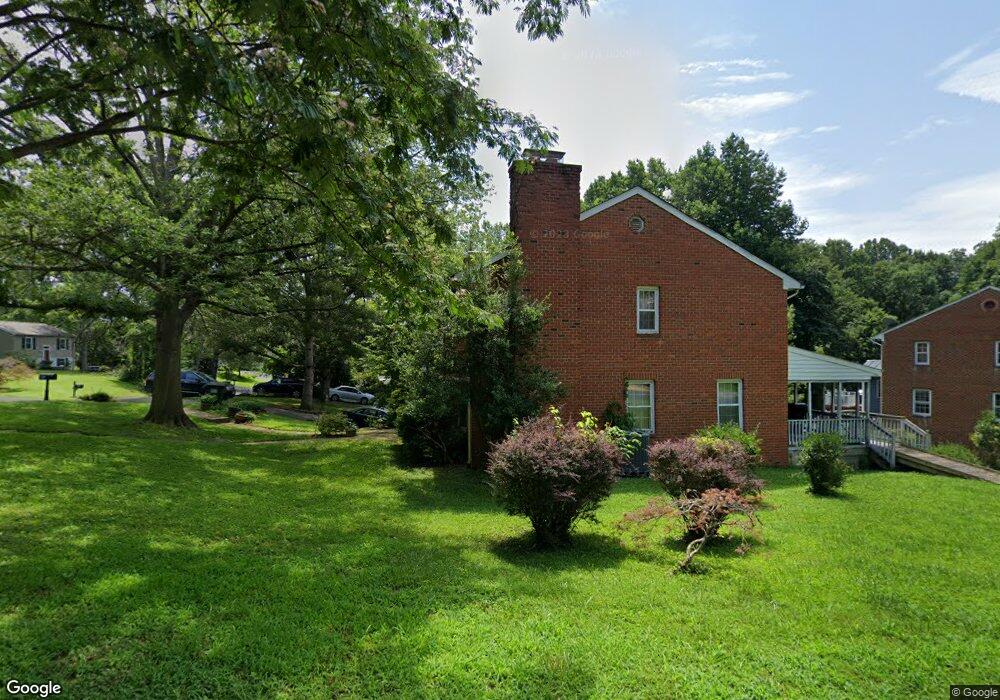
1103 Vegas Ct Charlottesville, VA 22901
Dunlora NeighborhoodEstimated Value: $377,000 - $385,694
3
Beds
3
Baths
1,936
Sq Ft
$196/Sq Ft
Est. Value
About This Home
This home is located at 1103 Vegas Ct, Charlottesville, VA 22901 and is currently estimated at $380,174, approximately $196 per square foot. 1103 Vegas Ct is a home located in Albemarle County with nearby schools including Agnor Elementary School, Jackson P. Burley Middle School, and Albemarle High School.
Ownership History
Date
Name
Owned For
Owner Type
Purchase Details
Closed on
Dec 7, 2016
Sold by
Gray Alrich L and Gray Trevor K
Bought by
Callaham Jordan C
Current Estimated Value
Home Financials for this Owner
Home Financials are based on the most recent Mortgage that was taken out on this home.
Original Mortgage
$200,700
Outstanding Balance
$162,162
Interest Rate
3.54%
Mortgage Type
New Conventional
Estimated Equity
$218,012
Create a Home Valuation Report for This Property
The Home Valuation Report is an in-depth analysis detailing your home's value as well as a comparison with similar homes in the area
Home Values in the Area
Average Home Value in this Area
Purchase History
| Date | Buyer | Sale Price | Title Company |
|---|---|---|---|
| Callaham Jordan C | $223,000 | Stewart Title |
Source: Public Records
Mortgage History
| Date | Status | Borrower | Loan Amount |
|---|---|---|---|
| Open | Callaham Jordan C | $200,700 |
Source: Public Records
Tax History Compared to Growth
Tax History
| Year | Tax Paid | Tax Assessment Tax Assessment Total Assessment is a certain percentage of the fair market value that is determined by local assessors to be the total taxable value of land and additions on the property. | Land | Improvement |
|---|---|---|---|---|
| 2025 | $3,269 | $365,700 | $81,800 | $283,900 |
| 2024 | $2,833 | $331,700 | $71,100 | $260,600 |
| 2023 | $2,578 | $301,900 | $71,100 | $230,800 |
| 2022 | $2,511 | $294,000 | $71,100 | $222,900 |
| 2021 | $2,279 | $266,900 | $71,100 | $195,800 |
| 2020 | $2,105 | $246,500 | $71,100 | $175,400 |
| 2019 | $2,044 | $239,400 | $73,500 | $165,900 |
| 2018 | $1,827 | $221,300 | $58,800 | $162,500 |
| 2017 | $1,796 | $214,100 | $44,100 | $170,000 |
| 2016 | $1,555 | $185,300 | $44,100 | $141,200 |
| 2015 | $743 | $181,500 | $44,100 | $137,400 |
| 2014 | -- | $179,600 | $44,100 | $135,500 |
Source: Public Records
Map
Nearby Homes
- 1101 Vegas Ct
- 1105 Vegas Ct Unit A
- 519 Woodmont Dr
- 1109 Vegas Ct
- 535 Woodmont Dr
- 530 Woodmont Dr
- 532 Woodmont Dr
- 515 Woodmont Dr
- 1104 Vegas Ct
- 526 Woodmont Dr
- 1113 Vegas Ct
- 524 Woodmont Dr
- 520 Woodmont Dr
- 1108 Vegas Ct
- 511 Woodmont Dr
- 516 Woodmont Dr
- 1117 Vegas Ct
- 539 Woodmont Dr
- 1112 Vegas Ct
- 512 Woodmont Dr