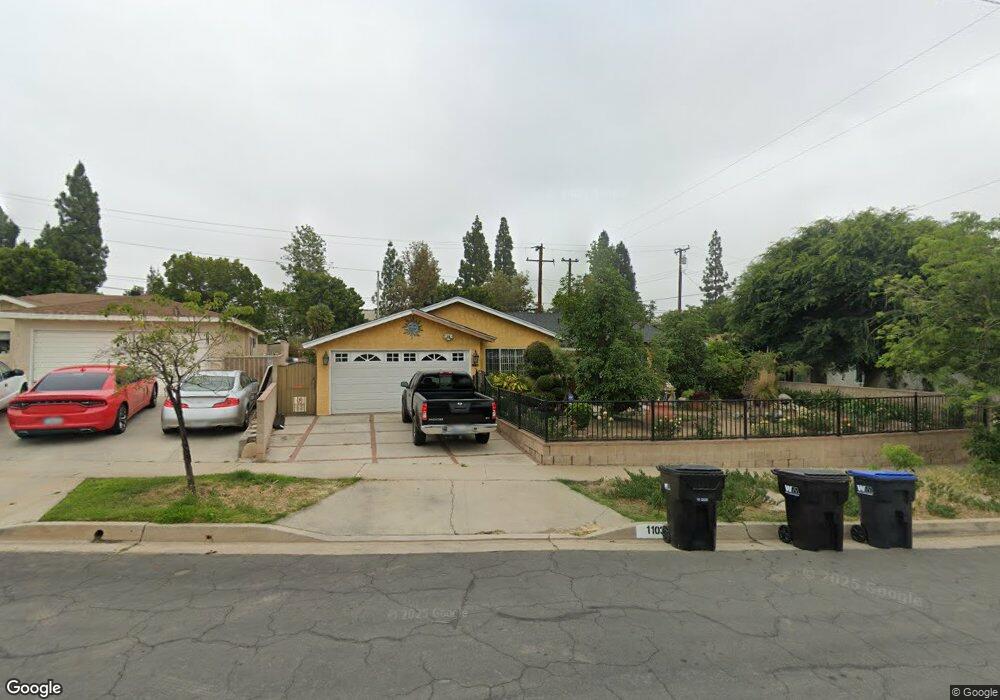
1103 W Venton St San Dimas, CA 91773
Estimated Value: $817,842 - $890,000
3
Beds
2
Baths
1,412
Sq Ft
$602/Sq Ft
Est. Value
About This Home
This home is located at 1103 W Venton St, San Dimas, CA 91773 and is currently estimated at $850,211, approximately $602 per square foot. 1103 W Venton St is a home located in Los Angeles County with nearby schools including Gladstone Elementary School, Lone Hill Middle School, and San Dimas High School.
Ownership History
Date
Name
Owned For
Owner Type
Purchase Details
Closed on
Jan 24, 2003
Sold by
Corral Hugo F
Bought by
Corral Hugo F and Corral Liz L
Current Estimated Value
Home Financials for this Owner
Home Financials are based on the most recent Mortgage that was taken out on this home.
Original Mortgage
$154,283
Interest Rate
5.97%
Purchase Details
Closed on
May 30, 2001
Sold by
Corral Jaime R
Bought by
Corral Hugo F
Home Financials for this Owner
Home Financials are based on the most recent Mortgage that was taken out on this home.
Original Mortgage
$147,432
Interest Rate
7.15%
Mortgage Type
Purchase Money Mortgage
Purchase Details
Closed on
Jul 28, 2000
Sold by
Nakanishi Steve P
Bought by
Corral Hugo F and Corral Jaime R
Home Financials for this Owner
Home Financials are based on the most recent Mortgage that was taken out on this home.
Original Mortgage
$145,000
Interest Rate
8.12%
Create a Home Valuation Report for This Property
The Home Valuation Report is an in-depth analysis detailing your home's value as well as a comparison with similar homes in the area
Home Values in the Area
Average Home Value in this Area
Purchase History
| Date | Buyer | Sale Price | Title Company |
|---|---|---|---|
| Corral Hugo F | -- | American Title | |
| Corral Hugo F | -- | Fidelity National Title Ins | |
| Corral Hugo F | $181,500 | Old Republic Title Company | |
| Corral Hugo F | -- | Old Republic Title Company |
Source: Public Records
Mortgage History
| Date | Status | Borrower | Loan Amount |
|---|---|---|---|
| Closed | Corral Hugo F | $154,283 | |
| Previous Owner | Corral Hugo F | $147,432 | |
| Previous Owner | Corral Hugo F | $145,000 |
Source: Public Records
Tax History Compared to Growth
Tax History
| Year | Tax Paid | Tax Assessment Tax Assessment Total Assessment is a certain percentage of the fair market value that is determined by local assessors to be the total taxable value of land and additions on the property. | Land | Improvement |
|---|---|---|---|---|
| 2025 | $4,150 | $321,388 | $193,208 | $128,180 |
| 2024 | $4,150 | $315,087 | $189,420 | $125,667 |
| 2023 | $4,058 | $308,909 | $185,706 | $123,203 |
| 2022 | $3,989 | $302,853 | $182,065 | $120,788 |
| 2021 | $3,907 | $296,916 | $178,496 | $118,420 |
| 2019 | $3,831 | $288,110 | $173,202 | $114,908 |
| 2018 | $3,587 | $282,461 | $169,806 | $112,655 |
| 2016 | $3,446 | $271,495 | $163,213 | $108,282 |
| 2015 | $3,392 | $267,418 | $160,762 | $106,656 |
| 2014 | $3,364 | $262,180 | $157,613 | $104,567 |
Source: Public Records
Map
Nearby Homes
- 1152 W Tudor St
- 1044 Kent Dr
- 1245 W Cienega Ave Sp 162
- 1245 W Cienega Ave Unit 183
- 1245 W Cienega Ave Unit 215
- 1245 W Cienega Ave Unit 95
- 1245 W Cienega Ave Unit 160
- 1245 W Cienega Ave Unit 13
- 1245 W Cienega Ave Unit 154
- 1245 W Cienega Ave Unit 18
- 1245 W Cienega Ave Unit 46
- 1245 W Cienega Ave Unit 75
- 1245 W Cienega Ave Unit 70
- 1205 Cypress St Unit 162
- 801 W Covina Blvd Unit 84
- 1443 W Greenhaven Ave
- 1138 Las Colinas Way
- 1433 Bentley Ct
- 1353 W Arrow Hwy
- 1150 W Juanita Ave
- 1102 W Tudor St
- 1113 W Venton St
- 1108 W Tudor St
- 1115 W Venton St
- 1124 W Venton St
- 1119 W Venton St
- 1127 W Tudor St
- 1123 W Venton St
- 1130 W Venton St
- 1135 W Tudor St
- 1118 W Tudor St
- 1129 W Venton St
- 1138 W Venton St
- 1135 W Venton St
- 1122 W Tudor St
- 440 S Lone Hill Ave
- 1141 W Tudor St
- 1128 W Tudor St
- 1144 W Venton St