Estimated Value: $112,000 - $148,000
2
Beds
1
Bath
816
Sq Ft
$155/Sq Ft
Est. Value
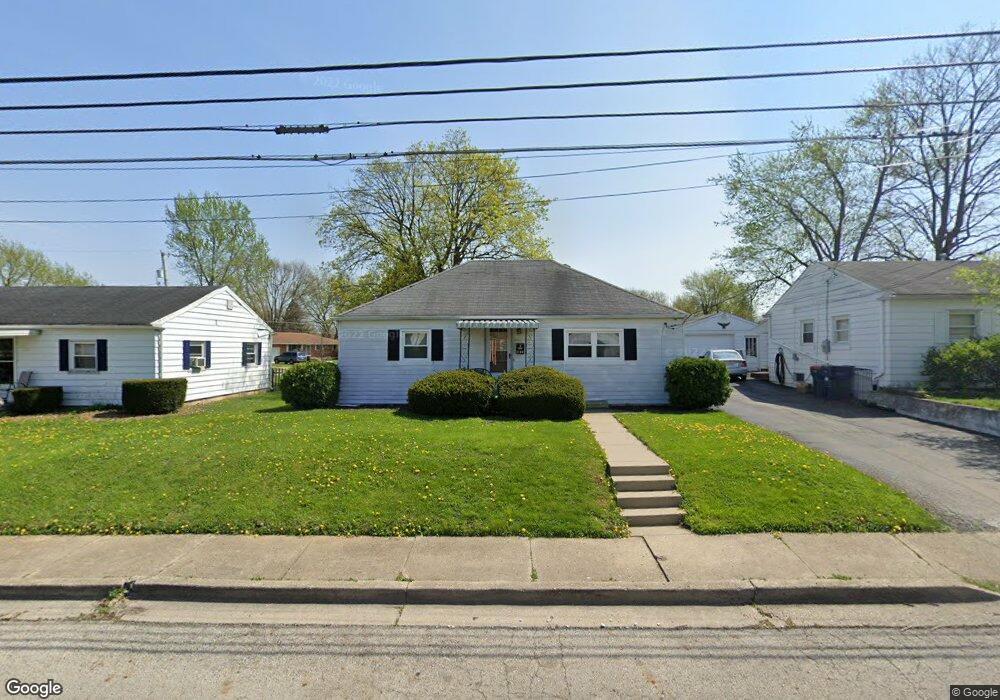
About This Home
This home is located at 1103 Young St, Piqua, OH 45356 and is currently estimated at $126,122, approximately $154 per square foot. 1103 Young St is a home located in Miami County with nearby schools including Piqua Junior High School, Piqua High School, and Nicholas School.
Ownership History
Date
Name
Owned For
Owner Type
Purchase Details
Closed on
May 16, 2007
Sold by
Sirch Dennis A and Sirch Mary E
Bought by
Schwartzengraber Brian A
Current Estimated Value
Home Financials for this Owner
Home Financials are based on the most recent Mortgage that was taken out on this home.
Original Mortgage
$71,000
Outstanding Balance
$43,281
Interest Rate
6.21%
Mortgage Type
New Conventional
Estimated Equity
$82,841
Purchase Details
Closed on
Oct 13, 2004
Sold by
Sirch Mary E
Bought by
Sirch Dennis A and Sirch Mary E
Purchase Details
Closed on
Jan 1, 1990
Bought by
Sirch George D
Create a Home Valuation Report for This Property
The Home Valuation Report is an in-depth analysis detailing your home's value as well as a comparison with similar homes in the area
Home Values in the Area
Average Home Value in this Area
Purchase History
| Date | Buyer | Sale Price | Title Company |
|---|---|---|---|
| Schwartzengraber Brian A | $71,000 | -- | |
| Sirch Dennis A | -- | -- | |
| Sirch George D | -- | -- |
Source: Public Records
Mortgage History
| Date | Status | Borrower | Loan Amount |
|---|---|---|---|
| Open | Sirch Dennis A | $71,000 |
Source: Public Records
Tax History Compared to Growth
Tax History
| Year | Tax Paid | Tax Assessment Tax Assessment Total Assessment is a certain percentage of the fair market value that is determined by local assessors to be the total taxable value of land and additions on the property. | Land | Improvement |
|---|---|---|---|---|
| 2024 | $1,103 | $26,150 | $6,300 | $19,850 |
| 2023 | $1,103 | $26,150 | $6,300 | $19,850 |
| 2022 | $1,093 | $26,150 | $6,300 | $19,850 |
| 2021 | $885 | $19,360 | $4,660 | $14,700 |
| 2020 | $867 | $19,360 | $4,660 | $14,700 |
| 2019 | $872 | $19,360 | $4,660 | $14,700 |
| 2018 | $885 | $18,760 | $4,690 | $14,070 |
| 2017 | $896 | $18,760 | $4,690 | $14,070 |
| 2016 | $886 | $18,760 | $4,690 | $14,070 |
| 2015 | $873 | $18,070 | $4,520 | $13,550 |
| 2014 | $873 | $18,070 | $4,520 | $13,550 |
| 2013 | $876 | $18,070 | $4,520 | $13,550 |
Source: Public Records
Map
Nearby Homes