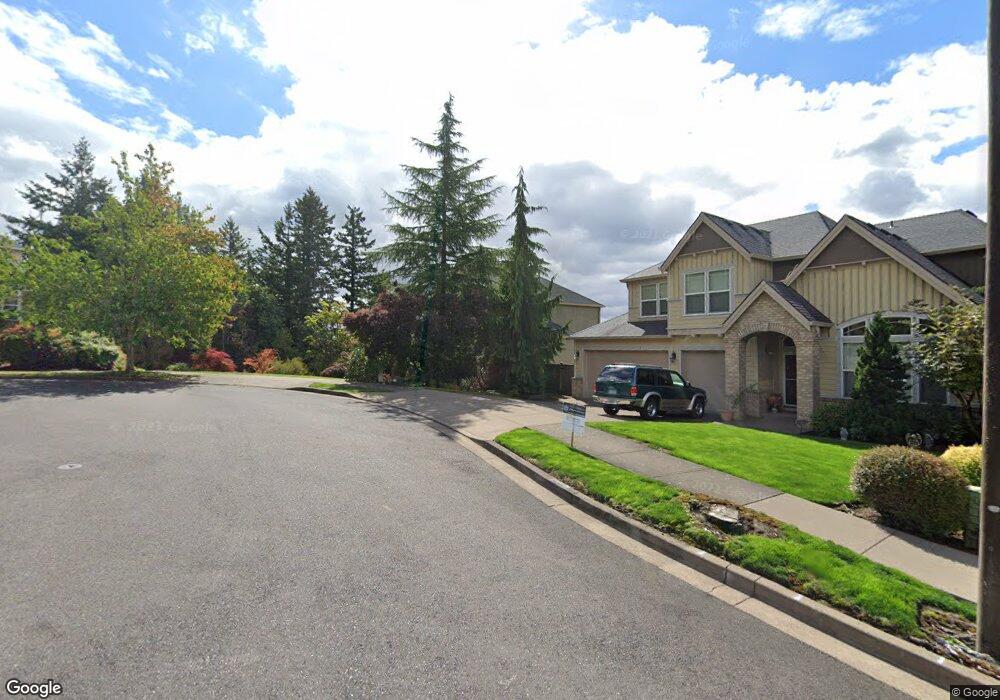
11030 SE Lenore St Happy Valley, OR 97086
Estimated Value: $855,000 - $1,040,000
5
Beds
4
Baths
3,468
Sq Ft
$264/Sq Ft
Est. Value
About This Home
This home is located at 11030 SE Lenore St, Happy Valley, OR 97086 and is currently estimated at $914,236, approximately $263 per square foot. 11030 SE Lenore St is a home located in Clackamas County with nearby schools including Mount Scott Elementary School, Rock Creek Middle School, and Clackamas High School.
Ownership History
Date
Name
Owned For
Owner Type
Purchase Details
Closed on
May 16, 2023
Sold by
Crise Nicole J
Bought by
Nicole J Crise Revocable Living Trust
Current Estimated Value
Purchase Details
Closed on
Mar 14, 2023
Sold by
Myers Jeanine L
Bought by
Jeanine L Myers Revocable Living Trust
Purchase Details
Closed on
Aug 11, 2014
Sold by
Crise Brian E
Bought by
Myers Jeanine L and Crise Nicole J
Home Financials for this Owner
Home Financials are based on the most recent Mortgage that was taken out on this home.
Original Mortgage
$377,000
Interest Rate
3.75%
Mortgage Type
Adjustable Rate Mortgage/ARM
Purchase Details
Closed on
Oct 27, 2004
Sold by
D R Horton Inc Portland
Bought by
Crise Brian E and Crise Nicole J
Home Financials for this Owner
Home Financials are based on the most recent Mortgage that was taken out on this home.
Original Mortgage
$333,550
Interest Rate
5.75%
Mortgage Type
Purchase Money Mortgage
Create a Home Valuation Report for This Property
The Home Valuation Report is an in-depth analysis detailing your home's value as well as a comparison with similar homes in the area
Home Values in the Area
Average Home Value in this Area
Purchase History
| Date | Buyer | Sale Price | Title Company |
|---|---|---|---|
| Nicole J Crise Revocable Living Trust | -- | None Listed On Document | |
| Jeanine L Myers Revocable Living Trust | -- | -- | |
| Myers Jeanine L | -- | Wfg Title | |
| Crise Brian E | $513,173 | First American Title Insuran |
Source: Public Records
Mortgage History
| Date | Status | Borrower | Loan Amount |
|---|---|---|---|
| Previous Owner | Myers Jeanine L | $377,000 | |
| Previous Owner | Crise Brian E | $333,550 |
Source: Public Records
Tax History Compared to Growth
Tax History
| Year | Tax Paid | Tax Assessment Tax Assessment Total Assessment is a certain percentage of the fair market value that is determined by local assessors to be the total taxable value of land and additions on the property. | Land | Improvement |
|---|---|---|---|---|
| 2024 | $11,537 | $587,613 | -- | -- |
| 2023 | $11,537 | $570,499 | $0 | $0 |
| 2022 | $10,619 | $553,883 | $0 | $0 |
| 2021 | $10,234 | $537,751 | $0 | $0 |
| 2020 | $9,706 | $522,089 | $0 | $0 |
| 2019 | $9,529 | $506,883 | $0 | $0 |
| 2018 | $8,582 | $492,119 | $0 | $0 |
| 2017 | $8,307 | $477,785 | $0 | $0 |
| 2016 | $8,014 | $463,869 | $0 | $0 |
| 2015 | $7,786 | $450,358 | $0 | $0 |
| 2014 | $7,231 | $437,241 | $0 | $0 |
Source: Public Records
Map
Nearby Homes
- 11295 SE Lenore St
- 11185 SE Lenore St
- 11060 SE Hilltop Ct
- 11560 SE 108th Ave
- 10932 SE Hilltop Ct
- 10810 SE Vista View Ln
- 11556 SE Cascade View Dr
- 10951 SE Valley View Terrace
- 10547 SE Charlotte Dr
- 11555 SE Hilltop Ct
- 11525 SE Bateleur Way Unit C6
- 11709 SE Crested Eagle Ln Unit E5
- 11806 SE Aerie Crescent Rd
- 11342 SE Aquila St
- 11438 SE Aquila St
- 10722 SE Idleman Rd
- 11719 SE Solomon Ct
- 11275 SE Aquila St
- 11480 SE Aquila St
- 11279 SE Falco St
- 11026 SE Lenore St
- 11034 SE Lenore St
- 11022 SE Lenore St
- 11018 SE Lenore St
- 11138 SE Lenore St
- 11301 SE Charview Ct
- 11014 SE Lenore St
- 10924 SE Lenore St
- 11198 SE Lenore St
- 10920 SE Lenore St
- 10928 SE Lenore St
- 11290 SE Lenore St
- 11326 SE Charview Ct
- 10916 SE Lenore St
- 11142 SE Lenore St
- 10912 SE Lenore St
- 11196 SE Lenore St
- 11010 SE Lenore St
- 11310 SE Lenore St
- 11311 SE Charview Ct