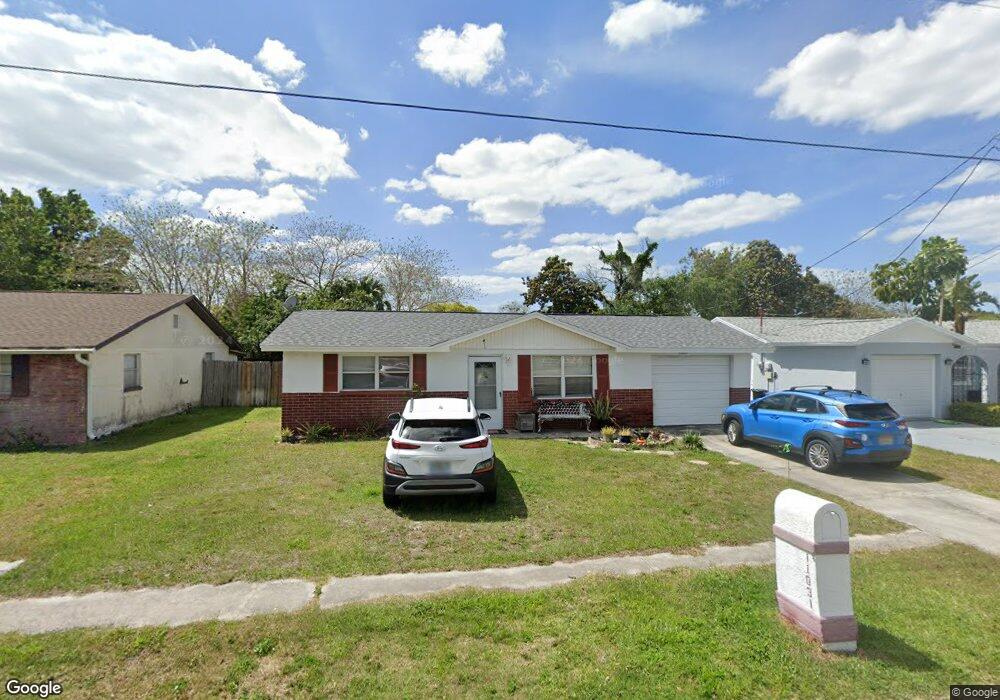
11031 Tyler Dr Port Richey, FL 34668
Estimated Value: $161,358 - $208,000
2
Beds
1
Bath
908
Sq Ft
$210/Sq Ft
Est. Value
About This Home
This home is located at 11031 Tyler Dr, Port Richey, FL 34668 and is currently estimated at $190,340, approximately $209 per square foot. 11031 Tyler Dr is a home located in Pasco County with nearby schools including Gulf Highlands Elementary School, Bayonet Point Middle School, and Fivay High School.
Ownership History
Date
Name
Owned For
Owner Type
Purchase Details
Closed on
Jun 15, 2017
Sold by
Warren Kim R and Warren Gordon L
Bought by
Sullivan Ann Janelle
Current Estimated Value
Purchase Details
Closed on
Jun 1, 2017
Bought by
Warren Kim R and Warren Gordon L
Purchase Details
Closed on
Mar 26, 1994
Sold by
Warren Kim R and Stanley James
Bought by
Warren Kim R and Warren Gordon L
Home Financials for this Owner
Home Financials are based on the most recent Mortgage that was taken out on this home.
Original Mortgage
$26,414
Interest Rate
7.47%
Mortgage Type
Purchase Money Mortgage
Purchase Details
Closed on
Mar 22, 1994
Sold by
Stanley Clifford E
Bought by
Warren Kim R and Warren Gordon L
Home Financials for this Owner
Home Financials are based on the most recent Mortgage that was taken out on this home.
Original Mortgage
$26,414
Interest Rate
7.47%
Mortgage Type
Purchase Money Mortgage
Create a Home Valuation Report for This Property
The Home Valuation Report is an in-depth analysis detailing your home's value as well as a comparison with similar homes in the area
Home Values in the Area
Average Home Value in this Area
Purchase History
| Date | Buyer | Sale Price | Title Company |
|---|---|---|---|
| Sullivan Ann Janelle | -- | None Available | |
| Warren Kim R | $100 | -- | |
| Warren Kim R | $18,000 | -- | |
| Warren Kim R | $6,000 | -- |
Source: Public Records
Mortgage History
| Date | Status | Borrower | Loan Amount |
|---|---|---|---|
| Previous Owner | Warren Kim R | $26,414 | |
| Previous Owner | Warren Kim R | $26,414 |
Source: Public Records
Tax History Compared to Growth
Tax History
| Year | Tax Paid | Tax Assessment Tax Assessment Total Assessment is a certain percentage of the fair market value that is determined by local assessors to be the total taxable value of land and additions on the property. | Land | Improvement |
|---|---|---|---|---|
| 2025 | $2,016 | $156,876 | $31,179 | $125,697 |
| 2024 | $2,016 | $158,962 | $31,179 | $127,783 |
| 2023 | $1,815 | $66,180 | $0 | $0 |
| 2022 | $1,405 | $103,233 | $17,328 | $85,905 |
| 2021 | $1,208 | $75,343 | $12,540 | $62,803 |
| 2020 | $1,125 | $70,358 | $7,410 | $62,948 |
| 2019 | $1,004 | $57,127 | $7,410 | $49,717 |
| 2018 | $933 | $52,582 | $7,410 | $45,172 |
| 2017 | $830 | $40,188 | $7,410 | $32,778 |
| 2016 | $724 | $34,145 | $6,270 | $27,875 |
| 2015 | $682 | $30,884 | $6,270 | $24,614 |
| 2014 | $647 | $29,892 | $6,270 | $23,622 |
Source: Public Records
Map
Nearby Homes
- 11011 Zimmerman Rd
- 11141 Zimmerman Rd
- 7311 Buchanan Dr
- 7510 Tyson Dr
- 7302 Quiet Ln
- 7425 Buchanan Dr
- 7317 Rhinebeck Dr
- 7338 Foxbloom Dr
- 10835 Gawain Rd
- 0 Martha Ave
- 7330 Rhinebeck Dr
- 7215 Lofty Dr
- 11031 Martha Ave
- 11309 Leisure Ln
- 7403 Foxbloom Dr
- 7201 Rhinebeck Dr
- 7615 Ilex Dr
- 7535 Lancelot Rd
- 11329 Leisure Ln
- 7217 Coventry Dr