Estimated Value: $665,000 - $908,000
3
Beds
3
Baths
2,273
Sq Ft
$328/Sq Ft
Est. Value
About This Home
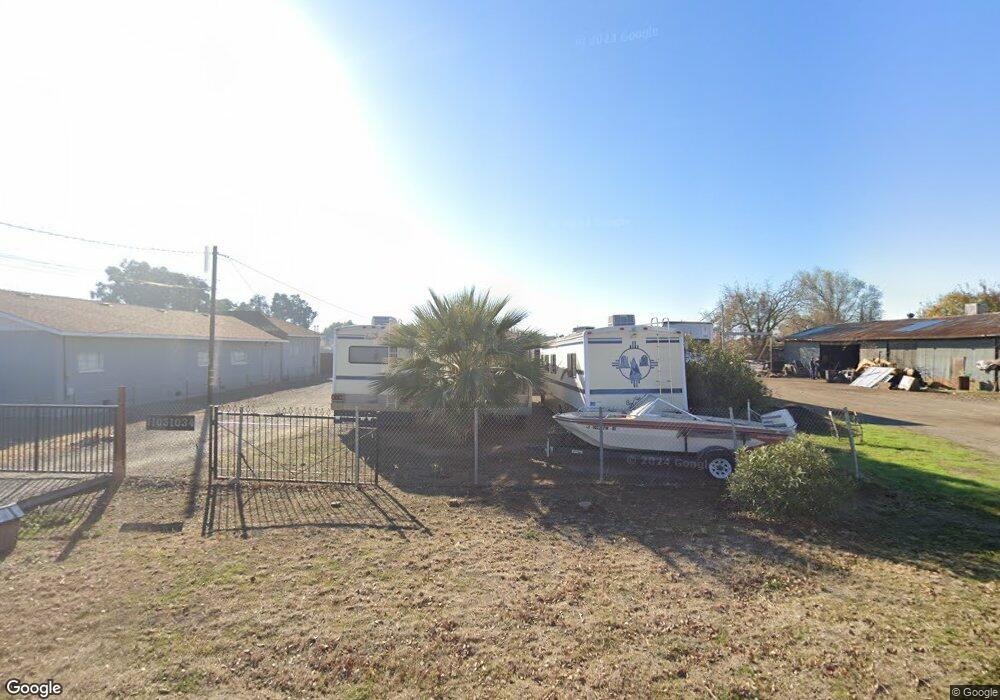
This home is located at 11034 W Clover Rd, Tracy, CA 95376 and is currently estimated at $746,005, approximately $328 per square foot. 11034 W Clover Rd is a home located in San Joaquin County with nearby schools including Melville S. Jacobson Elementary School, Monte Vista Middle School, and Merrill F. West High School.
Ownership History
Date
Name
Owned For
Owner Type
Purchase Details
Closed on
Oct 28, 2020
Sold by
Gudiel Otto Rodolfo and Gudiel Claribel
Bought by
Gudiel Otto R and The Otto R Gudiel Living Trust
Current Estimated Value
Home Financials for this Owner
Home Financials are based on the most recent Mortgage that was taken out on this home.
Original Mortgage
$405,000
Outstanding Balance
$360,392
Interest Rate
2.8%
Mortgage Type
New Conventional
Estimated Equity
$385,613
Purchase Details
Closed on
Oct 2, 2019
Sold by
Gudiel Otto R and Gudiel Otto R
Bought by
Gudiel Otto R and The Otto R Gudiel Living Trust
Purchase Details
Closed on
Mar 24, 2003
Sold by
Roberts Rex D and Roberts Lillian J
Bought by
Gudiel Otto R
Home Financials for this Owner
Home Financials are based on the most recent Mortgage that was taken out on this home.
Original Mortgage
$192,000
Interest Rate
7.8%
Create a Home Valuation Report for This Property
The Home Valuation Report is an in-depth analysis detailing your home's value as well as a comparison with similar homes in the area
Purchase History
| Date | Buyer | Sale Price | Title Company |
|---|---|---|---|
| Gudiel Otto R | -- | Fidelity National Title Co | |
| Gudiel Otto Rodolfo | -- | Fidelity National Title Co | |
| Gudiel Otto R | -- | None Available | |
| Gudiel Otto R | $242,500 | Chicago Title Co |
Source: Public Records
Mortgage History
| Date | Status | Borrower | Loan Amount |
|---|---|---|---|
| Open | Gudiel Otto Rodolfo | $405,000 | |
| Closed | Gudiel Otto R | $192,000 |
Source: Public Records
Tax History
| Year | Tax Paid | Tax Assessment Tax Assessment Total Assessment is a certain percentage of the fair market value that is determined by local assessors to be the total taxable value of land and additions on the property. | Land | Improvement |
|---|---|---|---|---|
| 2025 | $4,247 | $356,711 | $217,235 | $139,476 |
| 2024 | $3,923 | $349,718 | $212,976 | $136,742 |
| 2023 | $3,865 | $342,861 | $208,800 | $134,061 |
| 2022 | $3,789 | $336,139 | $204,706 | $131,433 |
| 2021 | $3,746 | $329,549 | $200,693 | $128,856 |
| 2020 | $3,723 | $326,171 | $198,636 | $127,535 |
| 2019 | $3,666 | $319,777 | $194,742 | $125,035 |
| 2018 | $3,607 | $313,508 | $190,924 | $122,584 |
| 2017 | $3,433 | $307,362 | $187,181 | $120,181 |
| 2016 | $3,473 | $301,337 | $183,512 | $117,825 |
| 2014 | $3,247 | $290,999 | $177,216 | $113,783 |
Source: Public Records
Map
Nearby Homes
- 812 W Clover Rd Unit 51
- 2901 San Rocco Ct
- 1695 Lavelle Smith Dr
- 3241 Arnaudo Ln
- 2270 Chester Dr
- 522 W Grant Line Rd
- 508 W Grant Line Rd
- 1800 Duncan Dr
- 875 Westleigh Ct
- 1974 Paradise Valley Ct
- 252 W Clover Rd Unit A
- 2935 Holly Dr
- 1930 Wall St
- 1823 Wall St
- 539 W Lowell Ave
- 445 W Lowell Ave
- 1890 Spring Valley Way
- 206 W 20th St
- 2734 Balboa Dr
- 251 Ramona Way
- 11076 W Clover Rd
- 10988 W Clover Rd
- 11102 W Clover Rd
- 10972 W Clover Rd
- 11138 W Clover Rd
- 10952 W Clover Rd
- 11061 W Clover Rd
- 11097 W Clover Rd
- 11045 W Clover Rd
- 10936 W Clover Rd
- 1401 Dronero Way
- 1391 Dronero Way
- 1431 Dronero Way
- 1361 Dronero Way
- 1461 Dronero Way
- 1331 Dronero Way
- 11196 W Clover Rd
- 1491 Dronero Way
- 1291 Dronero Way
- 1261 Dronero Way
Your Personal Tour Guide
Ask me questions while you tour the home.