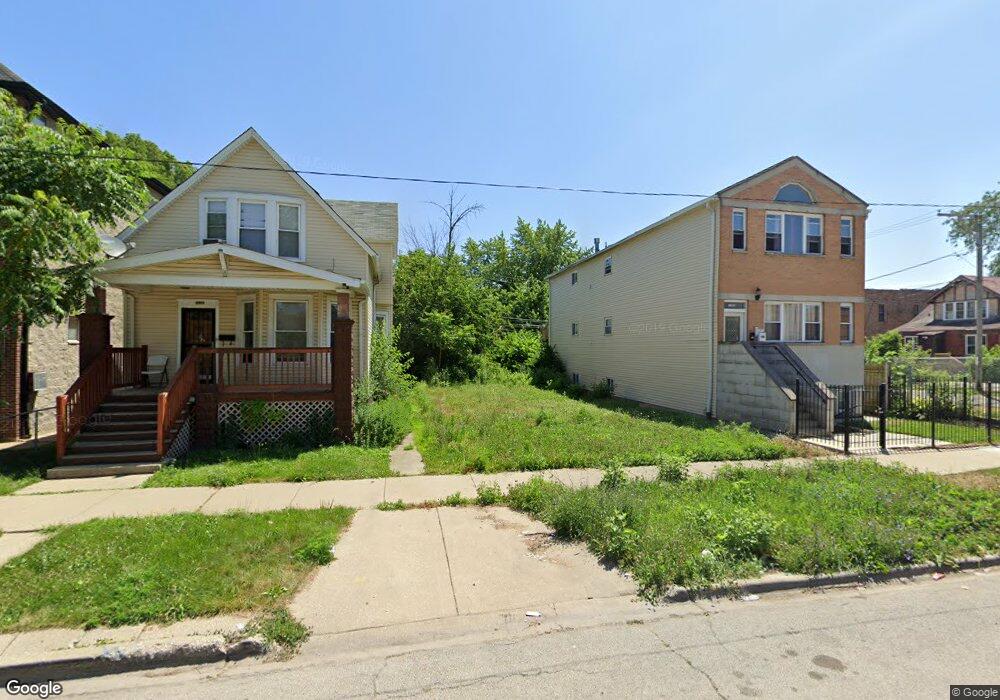
11037 S Edbrooke Ave Chicago, IL 60628
Roseland NeighborhoodEstimated Value: $174,833 - $187,000
3
Beds
2
Baths
819
Sq Ft
$221/Sq Ft
Est. Value
About This Home
This home is located at 11037 S Edbrooke Ave, Chicago, IL 60628 and is currently estimated at $180,917, approximately $220 per square foot. 11037 S Edbrooke Ave is a home located in Cook County with nearby schools including Lavizzo Elementary School, Corliss High School, and CICS Prairie.
Ownership History
Date
Name
Owned For
Owner Type
Purchase Details
Closed on
Jul 27, 2007
Sold by
Yousof Tommy Alaba
Bought by
Alaba Owolabi
Current Estimated Value
Home Financials for this Owner
Home Financials are based on the most recent Mortgage that was taken out on this home.
Original Mortgage
$104,000
Outstanding Balance
$66,016
Interest Rate
6.71%
Mortgage Type
Unknown
Estimated Equity
$114,901
Purchase Details
Closed on
Jan 28, 2002
Sold by
Xez Inc
Bought by
Yusouf Tommy Alaba
Home Financials for this Owner
Home Financials are based on the most recent Mortgage that was taken out on this home.
Original Mortgage
$76,800
Interest Rate
7.26%
Purchase Details
Closed on
Jul 25, 2001
Sold by
Capital Tax Corp
Bought by
Xez Inc
Purchase Details
Closed on
Jul 11, 2001
Sold by
U S Bank National Assn
Bought by
Capital Tax Corp
Purchase Details
Closed on
Jan 4, 2001
Sold by
Robinson Berdia
Bought by
Eqcc Home Equity Loan Trust 1999 & 3
Create a Home Valuation Report for This Property
The Home Valuation Report is an in-depth analysis detailing your home's value as well as a comparison with similar homes in the area
Home Values in the Area
Average Home Value in this Area
Purchase History
| Date | Buyer | Sale Price | Title Company |
|---|---|---|---|
| Alaba Owolabi | -- | Baird & Warner Title Service | |
| Yusouf Tommy Alaba | $96,000 | -- | |
| Xez Inc | $33,000 | -- | |
| Capital Tax Corp | $27,500 | -- | |
| Eqcc Home Equity Loan Trust 1999 & 3 | -- | -- |
Source: Public Records
Mortgage History
| Date | Status | Borrower | Loan Amount |
|---|---|---|---|
| Open | Alaba Owolabi | $104,000 | |
| Previous Owner | Yusouf Tommy Alaba | $76,800 |
Source: Public Records
Tax History Compared to Growth
Tax History
| Year | Tax Paid | Tax Assessment Tax Assessment Total Assessment is a certain percentage of the fair market value that is determined by local assessors to be the total taxable value of land and additions on the property. | Land | Improvement |
|---|---|---|---|---|
| 2024 | $433 | $1,890 | $1,890 | -- |
| 2023 | $422 | $2,048 | $2,048 | -- |
| 2022 | $422 | $2,048 | $2,048 | $0 |
| 2021 | $413 | $2,047 | $2,047 | $0 |
| 2020 | $457 | $2,047 | $2,047 | $0 |
| 2019 | $412 | $2,047 | $2,047 | $0 |
| 2018 | $405 | $2,047 | $2,047 | $0 |
| 2017 | $408 | $1,890 | $1,890 | $0 |
| 2016 | $379 | $1,890 | $1,890 | $0 |
| 2015 | $347 | $1,890 | $1,890 | $0 |
| 2014 | $293 | $1,575 | $1,575 | $0 |
| 2013 | $287 | $1,575 | $1,575 | $0 |
Source: Public Records
Map
Nearby Homes
- 153 E 110th St
- 124 E 110th St
- 11000 S Michigan Ave
- 10910 S Edbrooke Ave
- 10901 S Michigan Ave
- 12551-53 S State St
- 10924 S Wabash Ave
- 10916 S Wabash Ave
- 6 W 111th Place
- 11241 S Michigan Ave
- 32 W 109th Place
- 18 W 109th St
- 26 E 113th St
- 10947 S King Dr
- 1 W 112th Place
- 11317 S Edbrooke Ave
- 11022 S Vernon Ave
- 104 W 110th Place
- 10742 S Prairie Ave
- 121 W 110th St
- 11039 S Edbrooke Ave
- 11039 S Edbrooke Ave
- 11035 S Edbrooke Ave
- 11043 S Edbrooke Ave
- 11027 S Edbrooke Ave Unit 1
- 11027 S Edbrooke Ave
- 150 E 111th St
- 11023 S Edbrooke Ave
- 11032 S Indiana Ave
- 11032 S Indiana St
- 11036 S Indiana Ave
- 11040 S Indiana Ave Unit 2
- 11040 S Indiana Ave
- 154 E 111th St Unit 2
- 11019 S Edbrooke Ave
- 160 E 111th St
- 11034 S Edbrooke Ave
- 11034 S Edbrooke Ave
- 11024 S Indiana Ave
- 11031 S Edbrooke Ave Unit 3