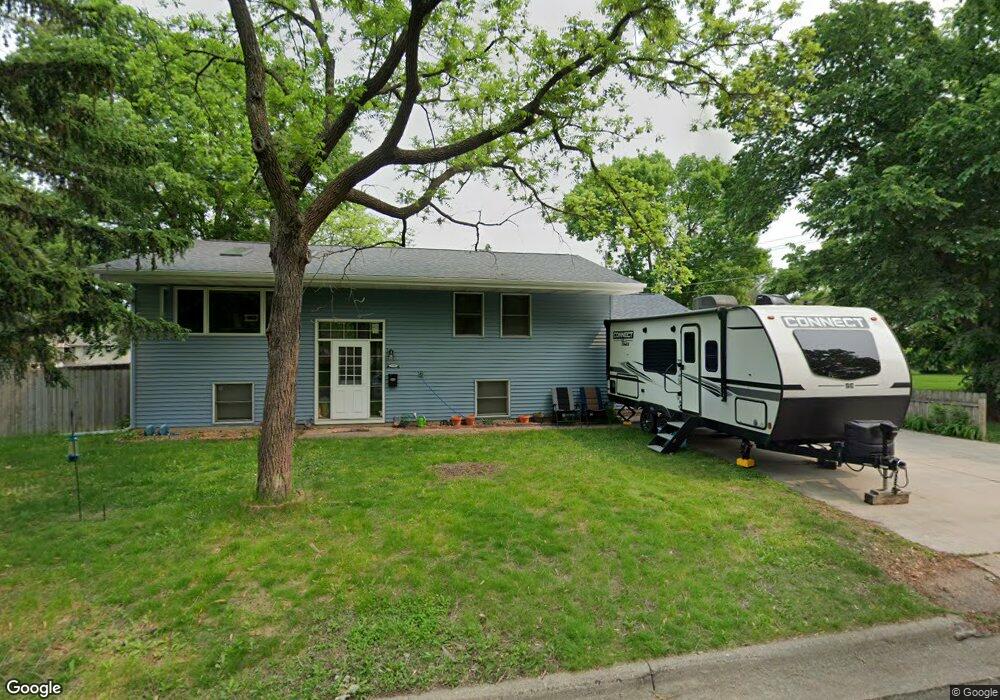
1104 3rd St W Hastings, MN 55033
Hastings-Marshan Township NeighborhoodEstimated Value: $369,000 - $413,000
5
Beds
2
Baths
2,344
Sq Ft
$164/Sq Ft
Est. Value
About This Home
This home is located at 1104 3rd St W, Hastings, MN 55033 and is currently estimated at $384,216, approximately $163 per square foot. 1104 3rd St W is a home located in Dakota County with nearby schools including Hastings Middle School, Christa Mcauliffe Elementary School, and Hastings High School.
Ownership History
Date
Name
Owned For
Owner Type
Purchase Details
Closed on
May 8, 2020
Sold by
Future And Hope Investments Llc
Bought by
Menge Kenan Avery and Menge Stepheanie Jay
Current Estimated Value
Home Financials for this Owner
Home Financials are based on the most recent Mortgage that was taken out on this home.
Original Mortgage
$290,030
Outstanding Balance
$257,965
Interest Rate
3.5%
Mortgage Type
Stand Alone Second
Estimated Equity
$126,252
Purchase Details
Closed on
Oct 12, 2012
Sold by
Federal National Mortgage Association
Bought by
Future & Hope Investments Llc
Purchase Details
Closed on
Feb 3, 2012
Sold by
Bank Of America National Association
Bought by
Federal National Mortgage Association
Purchase Details
Closed on
Nov 22, 2011
Sold by
Josephs Robert and Josephs Melissa A
Bought by
Bac Home Loans Servicing Lp
Purchase Details
Closed on
Sep 29, 2006
Sold by
Hubley David and Hubley Sheila
Bought by
Josephs Robert and Josephs Melissa
Create a Home Valuation Report for This Property
The Home Valuation Report is an in-depth analysis detailing your home's value as well as a comparison with similar homes in the area
Home Values in the Area
Average Home Value in this Area
Purchase History
| Date | Buyer | Sale Price | Title Company |
|---|---|---|---|
| Menge Kenan Avery | $299,000 | Dca Title | |
| Future & Hope Investments Llc | -- | Signature Title Midwest Serv | |
| Federal National Mortgage Association | -- | None Available | |
| Bac Home Loans Servicing Lp | $233,254 | None Available | |
| Josephs Robert | $215,000 | -- |
Source: Public Records
Mortgage History
| Date | Status | Borrower | Loan Amount |
|---|---|---|---|
| Open | Menge Kenan Avery | $290,030 |
Source: Public Records
Tax History Compared to Growth
Tax History
| Year | Tax Paid | Tax Assessment Tax Assessment Total Assessment is a certain percentage of the fair market value that is determined by local assessors to be the total taxable value of land and additions on the property. | Land | Improvement |
|---|---|---|---|---|
| 2024 | $4,168 | $357,700 | $71,800 | $285,900 |
| 2023 | $4,168 | $360,900 | $71,900 | $289,000 |
| 2022 | $3,538 | $354,500 | $71,700 | $282,800 |
| 2021 | $3,404 | $287,300 | $62,400 | $224,900 |
| 2020 | $3,474 | $274,500 | $59,400 | $215,100 |
| 2019 | $3,479 | $270,700 | $56,600 | $214,100 |
| 2018 | $3,231 | $257,300 | $53,900 | $203,400 |
| 2017 | $2,923 | $230,800 | $51,300 | $179,500 |
| 2016 | $2,863 | $207,700 | $48,000 | $159,700 |
| 2015 | $2,792 | $198,200 | $46,500 | $151,700 |
| 2014 | -- | $194,400 | $44,800 | $149,600 |
| 2013 | -- | $172,200 | $40,600 | $131,600 |
Source: Public Records
Map
Nearby Homes
- 145x 4th St W
- 101 Farm St Unit A
- 900 5th St W
- 404 Pleasant Dr
- 822 5th St W
- 401 Whispering Ln
- 930 Lyn Way Unit 204
- 642 Pleasant Dr
- 1404 Featherstone Rd
- 300 Whispering Ln Unit 201
- 628 4th St W
- 1306 Lincoln Ln
- 626 6th St W
- 1100 Honeysuckle Ln
- 515 5th St W
- 1221 14th St W
- 1227 14th St W
- 809 11th St W
- 317 3rd St W
- 302 3rd St W