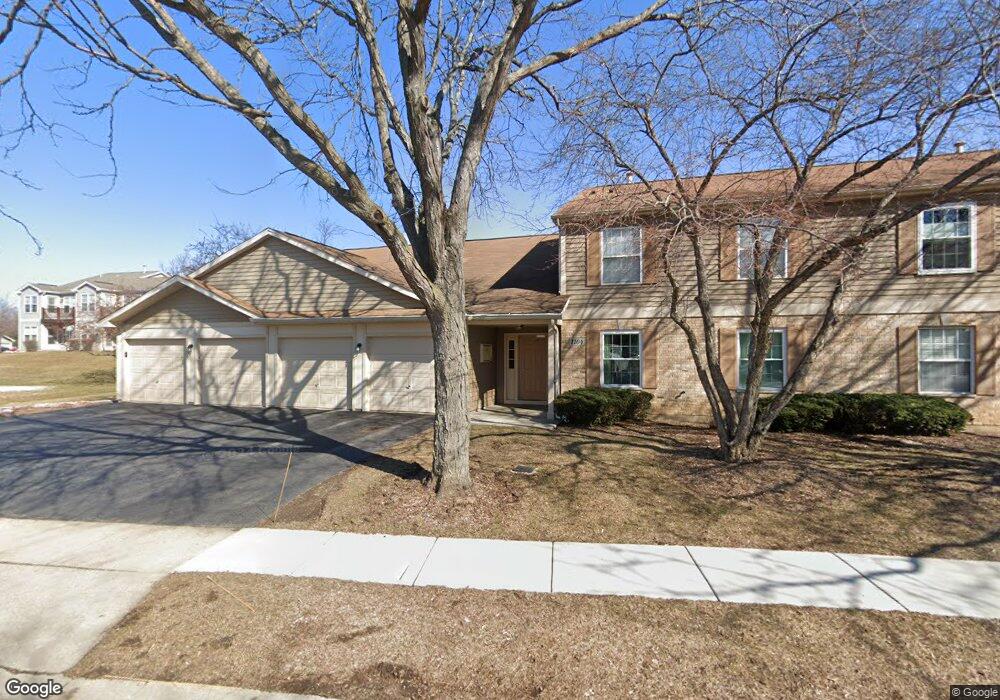
1104 Canterbury Ct Unit 10A2 Elgin, IL 60120
Bluff City NeighborhoodEstimated Value: $216,000 - $267,000
2
Beds
--
Bath
1,350
Sq Ft
$178/Sq Ft
Est. Value
About This Home
This home is located at 1104 Canterbury Ct Unit 10A2, Elgin, IL 60120 and is currently estimated at $239,628, approximately $177 per square foot. 1104 Canterbury Ct Unit 10A2 is a home located in Cook County with nearby schools including Hilltop Elementary School, Ellis Middle School, and Elgin High School.
Ownership History
Date
Name
Owned For
Owner Type
Purchase Details
Closed on
Mar 20, 2000
Sold by
Diehl Andrew J and Diehl Jennifer L
Bought by
Carter Michael L
Current Estimated Value
Home Financials for this Owner
Home Financials are based on the most recent Mortgage that was taken out on this home.
Original Mortgage
$61,800
Interest Rate
8.43%
Purchase Details
Closed on
Jul 12, 1994
Sold by
Parkway Bank & Trust Company
Bought by
Diehl Andrew J and Diehl Jennifer L
Home Financials for this Owner
Home Financials are based on the most recent Mortgage that was taken out on this home.
Original Mortgage
$89,150
Interest Rate
8.59%
Mortgage Type
FHA
Create a Home Valuation Report for This Property
The Home Valuation Report is an in-depth analysis detailing your home's value as well as a comparison with similar homes in the area
Home Values in the Area
Average Home Value in this Area
Purchase History
| Date | Buyer | Sale Price | Title Company |
|---|---|---|---|
| Carter Michael L | $103,000 | Chicago Title Insurance Co | |
| Diehl Andrew J | $92,500 | Land Title Group Inc |
Source: Public Records
Mortgage History
| Date | Status | Borrower | Loan Amount |
|---|---|---|---|
| Previous Owner | Carter Michael L | $61,800 | |
| Previous Owner | Diehl Andrew J | $89,150 |
Source: Public Records
Tax History Compared to Growth
Tax History
| Year | Tax Paid | Tax Assessment Tax Assessment Total Assessment is a certain percentage of the fair market value that is determined by local assessors to be the total taxable value of land and additions on the property. | Land | Improvement |
|---|---|---|---|---|
| 2024 | $3,816 | $16,576 | $2,386 | $14,190 |
| 2023 | $3,680 | $16,576 | $2,386 | $14,190 |
| 2022 | $3,680 | $16,576 | $2,386 | $14,190 |
| 2021 | $2,764 | $11,352 | $1,927 | $9,425 |
| 2020 | $2,825 | $11,352 | $1,927 | $9,425 |
| 2019 | $2,856 | $12,749 | $1,927 | $10,822 |
| 2018 | $1,937 | $9,135 | $1,651 | $7,484 |
| 2017 | $1,951 | $9,135 | $1,651 | $7,484 |
| 2016 | $2,115 | $9,135 | $1,651 | $7,484 |
| 2015 | $1,966 | $8,218 | $1,468 | $6,750 |
| 2014 | $1,922 | $8,218 | $1,468 | $6,750 |
| 2013 | $1,839 | $8,218 | $1,468 | $6,750 |
Source: Public Records
Map
Nearby Homes
- 1106 Stratford Ct Unit C
- 1023 Berkshire Ct Unit C
- 1101 Yorkshire Ct Unit C
- 386 Campus Dr
- 358 David Dr
- 653 Hampton Cir
- 1002 Bruce Dr
- 445 Lucile Ave
- 149 Highbury Dr
- 130 Stonehurst Dr
- 520 Aller Ave
- 26 Glen Echo Rd
- 821 Bode Rd Unit 15
- 1529 Keystone Ct Unit 416
- 386 Gladstone Ln Unit 475
- 764 Terrace Ct Unit A
- 614 Littleton Trail Unit 262
- 170 Dickens Trail
- 650 Littleton Trail Unit 224
- 614 Illinois Ave
- 1104 Canterbury Ct Unit B
- 1104 Canterbury Ct Unit 10B2
- 1104 Canterbury Ct Unit 10B1
- 1104 Canterbury Ct Unit 10A1
- 1104 Canterbury Ct Unit C
- 1104 Canterbury Ct Unit A
- 1106 Canterbury Ct Unit 10B1
- 1106 Canterbury Ct Unit 10A1
- 1106 Canterbury Ct Unit 10A2
- 1100 Canterbury Ct Unit D
- 1100 Canterbury Ct Unit 11B11
- 1100 Canterbury Ct Unit 11A21
- 1100 Canterbury Ct Unit 11B21
- 1100 Canterbury Ct Unit 11A11
- 1100 Canterbury Ct Unit A
- 325 Buckingham Cir Unit 4A
- 325 Buckingham Cir Unit 4A
- 325 Buckingham Cir Unit 4A
- 325 Buckingham Cir Unit 4A
- 325 Buckingham Cir Unit D