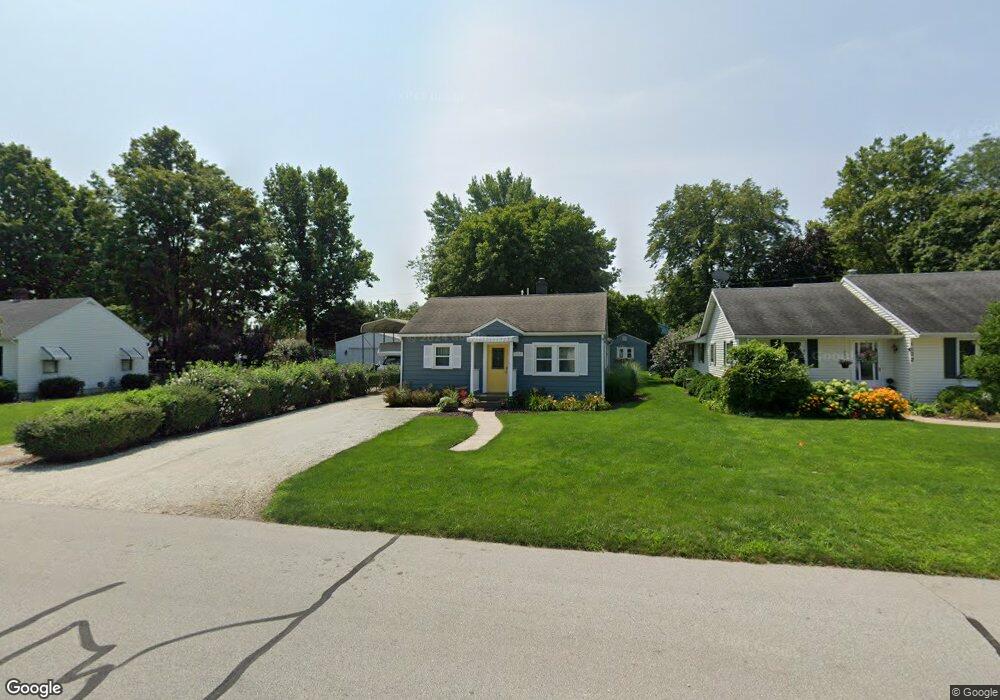
1104 E 3rd St Fowler, IN 47944
Estimated Value: $127,000 - $141,000
2
Beds
1
Bath
1,008
Sq Ft
$135/Sq Ft
Est. Value
About This Home
This home is located at 1104 E 3rd St, Fowler, IN 47944 and is currently estimated at $135,921, approximately $134 per square foot. 1104 E 3rd St is a home located in Benton County with nearby schools including Benton Central Junior/Senior High School and Sacred Heart Elementary School.
Ownership History
Date
Name
Owned For
Owner Type
Purchase Details
Closed on
Aug 7, 2013
Sold by
Lane David G
Bought by
Lane Bradley J
Current Estimated Value
Purchase Details
Closed on
Sep 3, 2000
Sold by
Not Provided
Bought by
Not Provided
Create a Home Valuation Report for This Property
The Home Valuation Report is an in-depth analysis detailing your home's value as well as a comparison with similar homes in the area
Purchase History
| Date | Buyer | Sale Price | Title Company |
|---|---|---|---|
| Lane Bradley J | $25,000 | -- | |
| Not Provided | $44,000 | -- |
Source: Public Records
Tax History
| Year | Tax Paid | Tax Assessment Tax Assessment Total Assessment is a certain percentage of the fair market value that is determined by local assessors to be the total taxable value of land and additions on the property. | Land | Improvement |
|---|---|---|---|---|
| 2025 | $755 | $83,500 | $7,400 | $76,100 |
| 2024 | $755 | $91,700 | $7,400 | $84,300 |
| 2023 | $604 | $80,500 | $6,600 | $73,900 |
| 2022 | $531 | $59,300 | $6,600 | $52,700 |
| 2021 | $477 | $48,800 | $6,600 | $42,200 |
| 2020 | $465 | $48,600 | $6,600 | $42,000 |
| 2019 | $417 | $46,200 | $6,400 | $39,800 |
| 2018 | $296 | $41,200 | $6,400 | $34,800 |
| 2017 | $368 | $40,400 | $6,400 | $34,000 |
| 2016 | $294 | $35,100 | $6,400 | $28,700 |
| 2014 | $272 | $31,600 | $6,200 | $25,400 |
| 2013 | $272 | $31,300 | $5,900 | $25,400 |
Source: Public Records
Map
Nearby Homes
- 1009 E 4th St
- 909 E 8th St
- 201 S Grant Ave
- 305 N Lincoln Ave
- 902 E 8th St
- 601 E 3rd St
- 303 N Jackson Ave
- 502 E 5th St
- 602 S Park Dr
- 501 E 7th St
- 503 E 8th St
- 700 S Sharon Ave
- 202 N Van Buren Ave
- 307 N Madison Ave
- 310 E 7th St
- 206 E Maple St
- 705 N Adams Ave
- 307 N Washington Ave
- 111 W 4th St
- 703 W 2nd St
Your Personal Tour Guide
Ask me questions while you tour the home.