NOT LISTED FOR SALE

Estimated Value: $227,000 - $235,000

3 Beds
2 Baths
1,200 Sq Ft
$191/Sq Ft Est. Value

Last Sold November 19, 2025

Last sale price $210,000 $175 Per Sq Ft

Est. 9% increase in value since last sale

Current estimated payment $1,606/month

About This Home

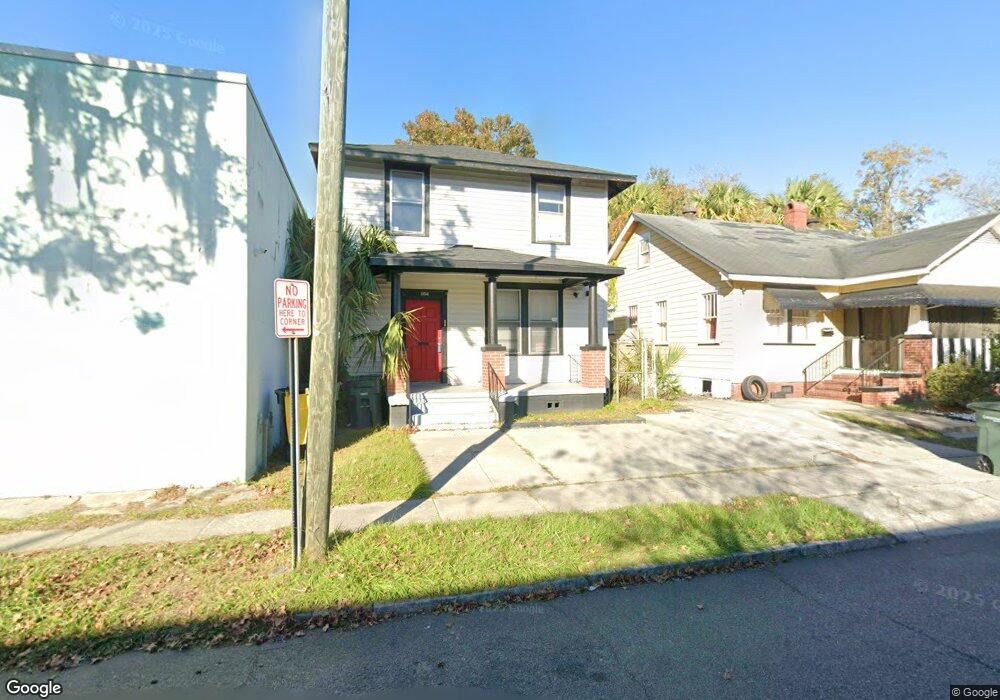
This home is located at 1104 E 40th St, Savannah, GA 31404 and is currently estimated at $229,427, approximately $191 per square foot. 1104 E 40th St is a home located in Chatham County with nearby schools including Spencer Elementary School, Hubert Middle School, and Savannah Arts Academy.

Ownership History

Date Name Owned For Owner Type

Purchase Details

Closed on
Nov 19, 2025
Sold by
Sfm Management Services Llc
Bought by
Maxcy Robert Gregg
Current Estimated Value
$229,427

Purchase Details

Closed on
Sep 29, 2025
Sold by
White Cynthia
Bought by
Sfm Management Services Llc

Purchase Details

Closed on
Mar 12, 2025
Sold by
White Cynthia
Bought by
Sfm Management Services Llc

Purchase Details

Closed on
Feb 21, 2020
Sold by
Rivers Lomisher
Bought by
White Cynthia

Purchase Details

Closed on
Oct 11, 2011
Sold by
Sams Clarence
Bought by
Rivers Lomisher
Source: Public Records

Range of Values:

--
Value Increase
--
Percent Increase
--
Adjusted for Inflation
Collateral Analytics

Collateral Analytics Collateral Analytics AVMs (Automated Valuation Model) employ a number of statistical approaches combined with neighborhood-specific comparable selection guarantees the most up-to-date and precise valuations.

Not Available

Collateral Analytics does not have data for the current month. Please view the chart for historical values.

ICE

ICE Mortgage Technology ICE Mortgage Technology’s AVM (Automated Valuation Model) is a state-of-the-art online residential property valuation tool that provides a quick and accurate estimate of the value of almost any home in the U.S.

Not Available

ICE Mortgage Technology does not have data for the current month. Please view the chart for historical values.

First American

First American First American Data & Analytics’ next-generation AVM combines unrivaled data assets with a blended ensemble of valuation models to produce highly accurate, reliable valuations you can trust.

Not Available

First American does not have data for the current month. Please view the chart for historical values.

Quantarium

Quantarium Quantarium’s valuation service, repeatedly proven the industry’s most accurate and comprehensive, is supercharged with a self-learning and auto-tuning AI engine that continually becomes smarter and more accurate as it processes daily inputs from the industry’s leading RE data lake.

Not Available

Quantarium does not have data for the current month. Please view the chart for historical values.

Average Value
Not Available
List Price
Sold Price
Create a Home Valuation Report for This Property
The Home Valuation Report is an in-depth analysis detailing your home's value as well as a comparison with similar homes in the area

Home Values in the Area

Source: Public Records

Average Home Value in this Area


Source: Public Records

Purchase History

Date Buyer Sale Price Title Company
Sfm Management Services Llc -- --
Sfm Management Services Llc $200,000 --
White Cynthia $10,000 --
Rivers Lomisher -- --
Source: Public Records

Property History

Date Event Price List to Sale Price per Sq Ft Prior Sale
11/19/2025 11/19/25 Sold $210,000 -8.3% $175 / Sq Ft View Prior Sale
08/04/2025 08/04/25 Price Changed $229,000 -11.9% $191 / Sq Ft
06/26/2025 06/26/25 For Sale $259,900 -- $217 / Sq Ft

Tax History Compared to Growth

Source: Public Records

Tax History

Year Tax Paid Tax Assessment Tax Assessment Total Assessment is a certain percentage of the fair market value that is determined by local assessors to be the total taxable value of land and additions on the property. Land Improvement
2025 $4,816 $98,840 $28,000 $70,840
2024 $4,816 $82,880 $28,000 $54,880
2023 $764 $62,600 $15,000 $47,600
2022 $707 $57,920 $15,000 $42,920
2021 $2,116 $35,880 $6,000 $29,880
2020 $949 $30,040 $6,000 $24,040
2019 $1,738 $30,040 $6,000 $24,040
2018 $1,368 $25,520 $6,000 $19,520
2017 $584 $15,000 $3,360 $11,640
2016 $397 $13,600 $3,360 $10,240
2015 $492 $11,800 $3,360 $8,440
2014 $605 $10,920 $0 $0
Source: Public Records

Agents Affiliated with this Home

  • Section Image
See All Agents

Map