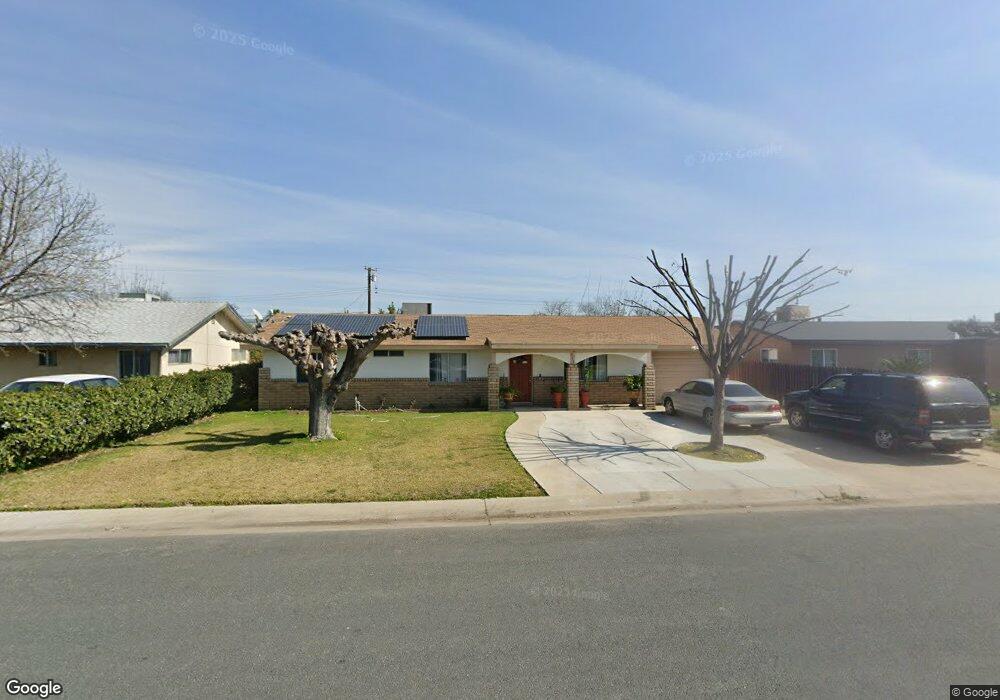
1104 N Cobb St Porterville, CA 93257
Porterville Northwest NeighborhoodEstimated Value: $272,563 - $331,000
3
Beds
2
Baths
1,185
Sq Ft
$253/Sq Ft
Est. Value
About This Home
This home is located at 1104 N Cobb St, Porterville, CA 93257 and is currently estimated at $300,141, approximately $253 per square foot. 1104 N Cobb St is a home located in Tulare County with nearby schools including Westfield Elementary School, Sequoia Middle School, and Monache High School.
Ownership History
Date
Name
Owned For
Owner Type
Purchase Details
Closed on
Dec 27, 2010
Sold by
Osullivan Thomas J
Bought by
Mata Miguel Garcia and Degarcia Maria Guido
Current Estimated Value
Home Financials for this Owner
Home Financials are based on the most recent Mortgage that was taken out on this home.
Original Mortgage
$94,443
Interest Rate
4.75%
Mortgage Type
FHA
Purchase Details
Closed on
Nov 10, 2010
Sold by
Citimortgage Inc
Bought by
Osullivan Thomas J and Osullivan Deborah
Home Financials for this Owner
Home Financials are based on the most recent Mortgage that was taken out on this home.
Original Mortgage
$94,443
Interest Rate
4.75%
Mortgage Type
FHA
Purchase Details
Closed on
Sep 23, 2010
Sold by
Torres Gloria
Bought by
Citimortgage Inc
Purchase Details
Closed on
Jun 25, 2007
Sold by
Torres Andres G
Bought by
Torres Gloria
Home Financials for this Owner
Home Financials are based on the most recent Mortgage that was taken out on this home.
Original Mortgage
$193,500
Interest Rate
6.66%
Mortgage Type
New Conventional
Create a Home Valuation Report for This Property
The Home Valuation Report is an in-depth analysis detailing your home's value as well as a comparison with similar homes in the area
Home Values in the Area
Average Home Value in this Area
Purchase History
| Date | Buyer | Sale Price | Title Company |
|---|---|---|---|
| Mata Miguel Garcia | $97,000 | Stewart Title Of California | |
| Osullivan Thomas J | $61,000 | None Available | |
| Citimortgage Inc | $57,493 | None Available | |
| Torres Gloria | -- | Chicago Title Company |
Source: Public Records
Mortgage History
| Date | Status | Borrower | Loan Amount |
|---|---|---|---|
| Previous Owner | Mata Miguel Garcia | $94,443 | |
| Previous Owner | Torres Gloria | $193,500 |
Source: Public Records
Tax History Compared to Growth
Tax History
| Year | Tax Paid | Tax Assessment Tax Assessment Total Assessment is a certain percentage of the fair market value that is determined by local assessors to be the total taxable value of land and additions on the property. | Land | Improvement |
|---|---|---|---|---|
| 2025 | $1,456 | $122,988 | $38,433 | $84,555 |
| 2024 | $1,456 | $120,578 | $37,680 | $82,898 |
| 2023 | $1,454 | $118,215 | $36,942 | $81,273 |
| 2022 | $1,414 | $115,898 | $36,218 | $79,680 |
| 2021 | $1,399 | $113,626 | $35,508 | $78,118 |
| 2020 | $1,386 | $112,461 | $35,144 | $77,317 |
| 2019 | $1,364 | $110,256 | $34,455 | $75,801 |
| 2018 | $1,342 | $108,094 | $33,779 | $74,315 |
| 2017 | $1,313 | $105,975 | $33,117 | $72,858 |
| 2016 | $1,266 | $103,897 | $32,468 | $71,429 |
| 2015 | $1,223 | $102,336 | $31,980 | $70,356 |
| 2014 | $1,223 | $100,332 | $31,354 | $68,978 |
Source: Public Records
Map
Nearby Homes
- 1045 N Westside St
- 1089 Pioneer Ave
- 1245 Atkins St
- 1076 N Beverly St
- 829 Pioneer Ave
- 793 Pioneer Ave
- 680 W Gerry Cir
- 681 W Mulberry Ave
- 700 N Prospect St
- 927 Shadowood Place
- 1121 N Lindale Way
- 701 W Theta Ave
- 701 Theta Ave
- 1370 Lindale Place
- 640 N Prospect St
- 1421 Pamela Cir
- 816 W Grand Ave
- 824 W Grand Ave
- 1450 W Brian Ln
- 1041 Greenfield Dr
- 1096 N Cobb St
- 1116 N Cobb St
- 1086 N Cobb St
- 1128 N Cobb St
- 1095 San Carlos St
- 1105 N San Carlos
- 1115 San Carlos St
- 1125 San Carlos St
- 1109 W Cobb
- 1083 San Carlos St
- 1109 N Cobb St
- 1074 N Cobb St
- 1089 N Cobb St
- 1119 N Cobb St
- 1138 N Cobb St
- 1145 San Carlos St
- 0 San Carlos St
- 1133 N Cobb St
- 1075 N Cobb St
- 1135 San Carlos St