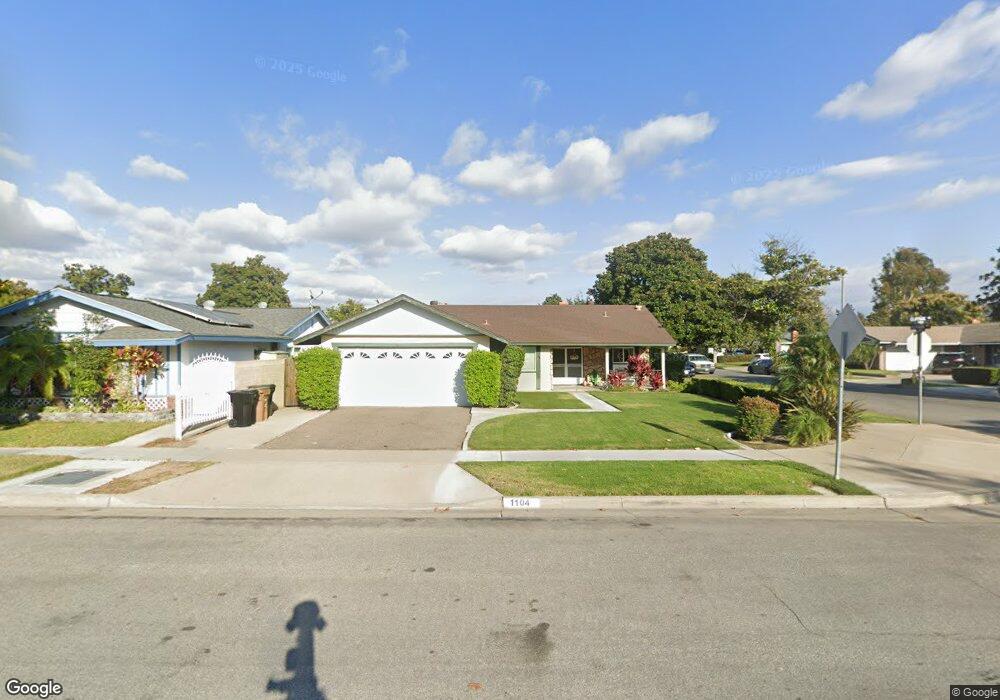
1104 S Clifpark Cir Anaheim, CA 92805
Southeast Anaheim NeighborhoodEstimated Value: $798,000 - $841,000
3
Beds
2
Baths
1,278
Sq Ft
$648/Sq Ft
Est. Value
About This Home
This home is located at 1104 S Clifpark Cir, Anaheim, CA 92805 and is currently estimated at $827,788, approximately $647 per square foot. 1104 S Clifpark Cir is a home located in Orange County with nearby schools including Theodore Roosevelt Elementary School, South Junior High School, and Katella High School.
Ownership History
Date
Name
Owned For
Owner Type
Purchase Details
Closed on
Jan 1, 2024
Sold by
Cansdale Peggysue C
Bought by
Cansdale Peggysue C
Current Estimated Value
Home Financials for this Owner
Home Financials are based on the most recent Mortgage that was taken out on this home.
Original Mortgage
$40,000
Outstanding Balance
$37,261
Interest Rate
6.67%
Mortgage Type
New Conventional
Estimated Equity
$790,527
Purchase Details
Closed on
Feb 24, 2016
Sold by
Cansdale Peggysue C
Bought by
Cansdale Michael Bryan
Purchase Details
Closed on
Feb 14, 2005
Sold by
Candsdale Peter W
Bought by
Cansdale Peggy Sue C
Purchase Details
Closed on
Mar 4, 2002
Sold by
Cansdale Peggysue C and Higuera Peggy Sue C
Bought by
Cansdale Peter W and Cansdale Peggysue C
Home Financials for this Owner
Home Financials are based on the most recent Mortgage that was taken out on this home.
Original Mortgage
$189,000
Interest Rate
6.85%
Create a Home Valuation Report for This Property
The Home Valuation Report is an in-depth analysis detailing your home's value as well as a comparison with similar homes in the area
Home Values in the Area
Average Home Value in this Area
Purchase History
| Date | Buyer | Sale Price | Title Company |
|---|---|---|---|
| Cansdale Peggysue C | -- | Chicago Title Company | |
| Cansdale Michael Bryan | -- | None Available | |
| Cansdale Peggy Sue C | -- | -- | |
| Cansdale Peter W | -- | -- |
Source: Public Records
Mortgage History
| Date | Status | Borrower | Loan Amount |
|---|---|---|---|
| Open | Cansdale Peggysue C | $40,000 | |
| Previous Owner | Cansdale Peter W | $189,000 |
Source: Public Records
Tax History Compared to Growth
Tax History
| Year | Tax Paid | Tax Assessment Tax Assessment Total Assessment is a certain percentage of the fair market value that is determined by local assessors to be the total taxable value of land and additions on the property. | Land | Improvement |
|---|---|---|---|---|
| 2025 | $2,878 | $237,976 | $134,212 | $103,764 |
| 2024 | $2,878 | $233,310 | $131,580 | $101,730 |
| 2023 | $2,890 | $228,736 | $129,000 | $99,736 |
| 2022 | $2,851 | $224,251 | $126,470 | $97,781 |
| 2021 | $2,853 | $219,854 | $123,990 | $95,864 |
| 2020 | $2,840 | $217,600 | $122,718 | $94,882 |
| 2019 | $2,761 | $213,334 | $120,312 | $93,022 |
| 2018 | $2,706 | $209,151 | $117,952 | $91,199 |
| 2017 | $2,604 | $205,050 | $115,639 | $89,411 |
| 2016 | $2,595 | $201,030 | $113,372 | $87,658 |
| 2015 | $2,571 | $198,011 | $111,669 | $86,342 |
| 2014 | $2,419 | $194,133 | $109,482 | $84,651 |
Source: Public Records
Map
Nearby Homes
- 1101 S Clifpark Cir
- 2144 E Almont Ave
- 617 E Eton Place
- 611 E Eton Place
- 1415 E South St
- 725 S Mosaic St
- 1615 E South St
- 760 S Olive St
- 651 E Valencia St
- 842 S Anaheim Blvd
- 1020 S Cambridge St
- 1206 W Cara Dr
- 1539 W Cara Dr
- 1638 S Urbana St
- 1422 S Urbana St
- 1403 W Bushell St
- 554 S Elder St
- 1407 W Bushell St
- 513 E Water St
- 718 S Claudina St
- 1100 S Clifpark Cir
- 1105 S Dover Cir
- 1101 S Dover Cir
- 1080 S Clifpark Cir
- 1212 E Clifpark Way
- 1216 E Clifpark Way
- 1079 S Dover Cir
- 1105 S Clifpark Cir
- 1111 S Clifpark Cir
- 1220 E Clifpark Way
- 1076 S Clifpark Cir
- 1079 S Clifpark Cir
- 1075 S Dover Cir
- 1115 S Clifpark Cir
- 1224 E Clifpark Way
- 1104 S Dover Cir
- 1072 S Clifpark Cir
- 1100 S Dover Cir
- 1071 S Dover Cir
- 1080 S Dover Cir