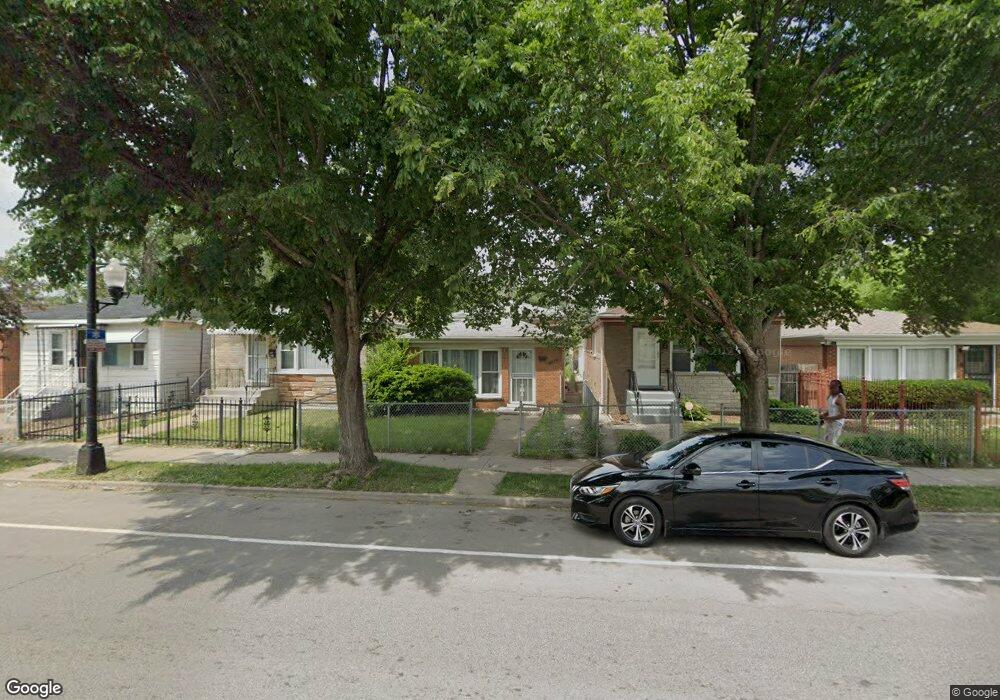
1104 W 111th St Chicago, IL 60643
Morgan Park NeighborhoodEstimated Value: $168,537 - $287,000
3
Beds
2
Baths
1,040
Sq Ft
$213/Sq Ft
Est. Value
About This Home
This home is located at 1104 W 111th St, Chicago, IL 60643 and is currently estimated at $221,634, approximately $213 per square foot. 1104 W 111th St is a home located in Cook County with nearby schools including John D. Shoop Elementary School and Morgan Park High School.
Ownership History
Date
Name
Owned For
Owner Type
Purchase Details
Closed on
Feb 25, 2004
Sold by
Banks Michael
Bought by
Mcshan Latoyra
Current Estimated Value
Home Financials for this Owner
Home Financials are based on the most recent Mortgage that was taken out on this home.
Original Mortgage
$102,000
Outstanding Balance
$52,544
Interest Rate
7.15%
Mortgage Type
New Conventional
Estimated Equity
$169,090
Purchase Details
Closed on
Apr 30, 2001
Sold by
Felton Linda and Banks Michael
Bought by
Mcshan Latoyra and Banks Michael
Home Financials for this Owner
Home Financials are based on the most recent Mortgage that was taken out on this home.
Original Mortgage
$64,350
Interest Rate
8.99%
Purchase Details
Closed on
Sep 11, 1997
Sold by
Felton Linda
Bought by
Felton Linda and Banks Michael
Purchase Details
Closed on
Aug 2, 1994
Sold by
West Alvin
Bought by
Felton Linda
Create a Home Valuation Report for This Property
The Home Valuation Report is an in-depth analysis detailing your home's value as well as a comparison with similar homes in the area
Home Values in the Area
Average Home Value in this Area
Purchase History
| Date | Buyer | Sale Price | Title Company |
|---|---|---|---|
| Mcshan Latoyra | -- | A Title Escrow Co Inc | |
| Mcshan Latoyra | -- | -- | |
| Felton Linda | -- | -- | |
| Felton Linda | $64,500 | -- |
Source: Public Records
Mortgage History
| Date | Status | Borrower | Loan Amount |
|---|---|---|---|
| Open | Mcshan Latoyra | $102,000 | |
| Previous Owner | Mcshan Latoyra | $64,350 |
Source: Public Records
Tax History Compared to Growth
Tax History
| Year | Tax Paid | Tax Assessment Tax Assessment Total Assessment is a certain percentage of the fair market value that is determined by local assessors to be the total taxable value of land and additions on the property. | Land | Improvement |
|---|---|---|---|---|
| 2024 | $1,414 | $8,200 | $1,875 | $6,325 |
| 2023 | $1,357 | $10,000 | $2,031 | $7,969 |
| 2022 | $1,357 | $10,000 | $2,031 | $7,969 |
| 2021 | $1,345 | $9,999 | $2,031 | $7,968 |
| 2020 | $1,480 | $9,731 | $2,031 | $7,700 |
| 2019 | $1,463 | $10,694 | $2,031 | $8,663 |
| 2018 | $1,437 | $10,694 | $2,031 | $8,663 |
| 2017 | $2,413 | $14,558 | $1,875 | $12,683 |
| 2016 | $2,421 | $14,558 | $1,875 | $12,683 |
| 2015 | $2,192 | $14,558 | $1,875 | $12,683 |
| 2014 | $1,866 | $12,599 | $1,718 | $10,881 |
| 2013 | $1,817 | $12,599 | $1,718 | $10,881 |
Source: Public Records
Map
Nearby Homes
- 1115 W 110th St
- 1105 W 111th Place
- 1203 W 110th St
- 11015 S Morgan St
- 1237 W 110th Place
- 1208 W 109th Place
- 1309 W 110th Place
- 10947 S Peoria St
- 1313 W 112th St
- 11147 S Peoria St
- 10825 S Sangamon St
- 11328 S Morgan St
- 1416 W 110th Place
- 11310 S Peoria St
- 1342 W 108th Place
- 11367 S Aberdeen St
- 11345 S Ada St
- 10651 S Racine Ave
- 10711 S Sangamon St
- 11425 S Elizabeth St
- 1102 W 111th St
- 1108 W 111th St
- 1100 W 111th St
- 1110 W 111th St
- 1114 W 111th St
- 1116 W 111th St
- 1118 W 111th St
- 1107 W 110th Place
- 1105 W 110th Place
- 1109 W 110th Place
- 1101 W 110th Place
- 1120 W 111th St
- 1117 W 110th Place
- 11045 S Aberdeen St
- 1122 W 111th St
- 1109 W 111th St
- 1113 W 111th St
- 1124 W 111th St
- 1121 W 110th Place
- 1115 W 111th St