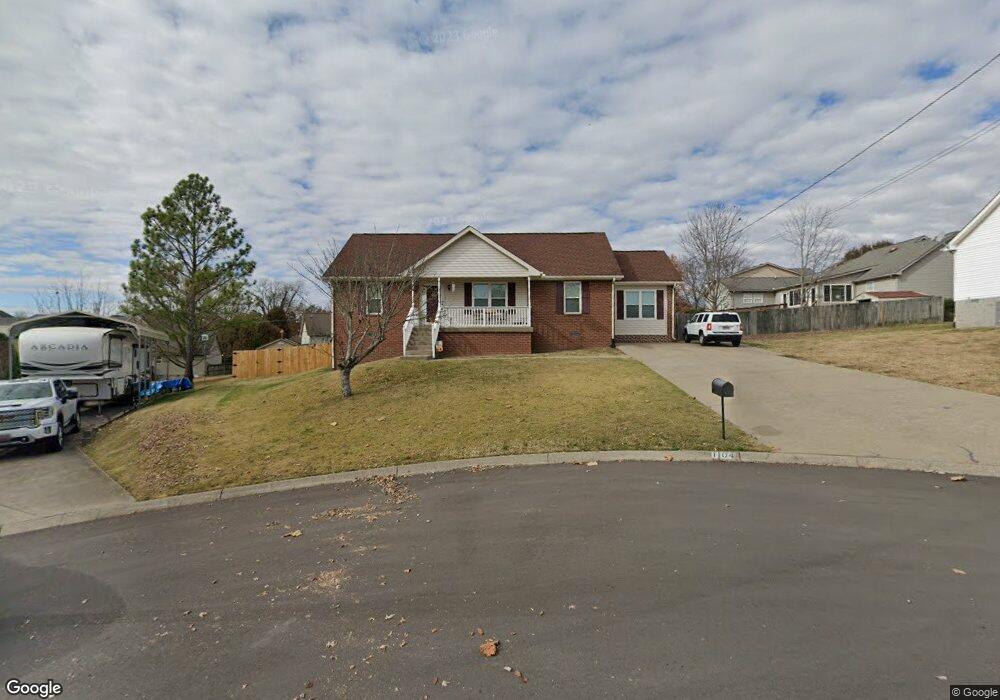
1104 Windtree Ct Mount Juliet, TN 37122
Estimated Value: $334,887 - $382,000
--
Bed
2
Baths
1,278
Sq Ft
$289/Sq Ft
Est. Value
About This Home
This home is located at 1104 Windtree Ct, Mount Juliet, TN 37122 and is currently estimated at $368,722, approximately $288 per square foot. 1104 Windtree Ct is a home located in Wilson County with nearby schools including W.A. Wright Elementary School, Mt. Juliet Middle School, and Green Hill High School.
Ownership History
Date
Name
Owned For
Owner Type
Purchase Details
Closed on
Jul 28, 2005
Sold by
Ward Thomas E
Bought by
Ross Tabor Gregory
Current Estimated Value
Home Financials for this Owner
Home Financials are based on the most recent Mortgage that was taken out on this home.
Original Mortgage
$50,000
Outstanding Balance
$25,961
Interest Rate
5.48%
Estimated Equity
$342,761
Purchase Details
Closed on
Dec 2, 2004
Sold by
Carter Ward Teresa D
Bought by
Ward Thomas E
Purchase Details
Closed on
Jul 14, 1998
Sold by
Universal Builders Llc
Bought by
Ward Thomas E and Ward Teresa D
Purchase Details
Closed on
May 6, 1998
Sold by
Universal Builders Llc
Bought by
Ward Thomas E and Car Teresa
Purchase Details
Closed on
Dec 5, 1997
Bought by
Universal Builders Llc
Create a Home Valuation Report for This Property
The Home Valuation Report is an in-depth analysis detailing your home's value as well as a comparison with similar homes in the area
Home Values in the Area
Average Home Value in this Area
Purchase History
| Date | Buyer | Sale Price | Title Company |
|---|---|---|---|
| Ross Tabor Gregory | $136,900 | -- | |
| Ward Thomas E | -- | -- | |
| Ward Thomas E | -- | -- | |
| Ward Thomas E | $100,850 | -- | |
| Universal Builders Llc | $300,000 | -- |
Source: Public Records
Mortgage History
| Date | Status | Borrower | Loan Amount |
|---|---|---|---|
| Open | Universal Builders Llc | $50,000 |
Source: Public Records
Tax History Compared to Growth
Tax History
| Year | Tax Paid | Tax Assessment Tax Assessment Total Assessment is a certain percentage of the fair market value that is determined by local assessors to be the total taxable value of land and additions on the property. | Land | Improvement |
|---|---|---|---|---|
| 2024 | $1,129 | $59,125 | $17,500 | $41,625 |
| 2022 | $1,129 | $59,125 | $17,500 | $41,625 |
| 2021 | $1,194 | $59,125 | $17,500 | $41,625 |
| 2020 | $1,079 | $59,125 | $17,500 | $41,625 |
| 2019 | $134 | $40,075 | $13,750 | $26,325 |
| 2018 | $1,076 | $40,075 | $13,750 | $26,325 |
| 2017 | $1,076 | $40,075 | $13,750 | $26,325 |
| 2016 | $1,076 | $40,075 | $13,750 | $26,325 |
| 2015 | $1,110 | $40,075 | $13,750 | $26,325 |
| 2014 | $916 | $33,046 | $0 | $0 |
Source: Public Records
Map
Nearby Homes
- 705 Pinehurst Point
- 716 Veneta View Dr
- 3194 Buchanan
- 734 Nonaville Rd
- 600 Windtree Pass
- 2550 Ashford Dr
- Weston Plan at Windtree - Signatures
- Landon Plan at Windtree - Estates
- Camden Plan at Windtree - Signatures
- Ashford Plan at Windtree - Estates
- Buchanan Plan at Windtree - Signatures
- Ansley Plan at Windtree - Estates
- Kingston Plan at Windtree - Estates
- Buchanan Plan at Windtree - Estates
- Camden Plan at Windtree - Estates
- Weston Plan at Windtree - Estates
- Nash Plan at Windtree - Prestige
- Landon Plan at Windtree - Signatures
- Kingston Plan at Windtree - Signatures
- Ashford Plan at Windtree - Signatures
- 1106 Windtree Ct
- 1025 Windtree Trace
- 1102 Windtree Ct
- 905 Pebble Pass
- 903 Pebble Pass
- 907 Pebble Pass
- 1027 Windtree Trace
- 1105 Windtree Ct
- 1021 Windtree Trace
- 814 Pebble Beach Cir
- 1103 Windtree Ct
- 816 Pebble Beach Cir
- 812 Pebble Beach Cir
- 1019 Windtree Trace
- 1034 Windtree Trace
- 810 Pebble Beach Cir
- 904 Pebble Pass
- 902 Pebble Pass
- 1032 Windtree Trace
- 1036 Windtree Trace