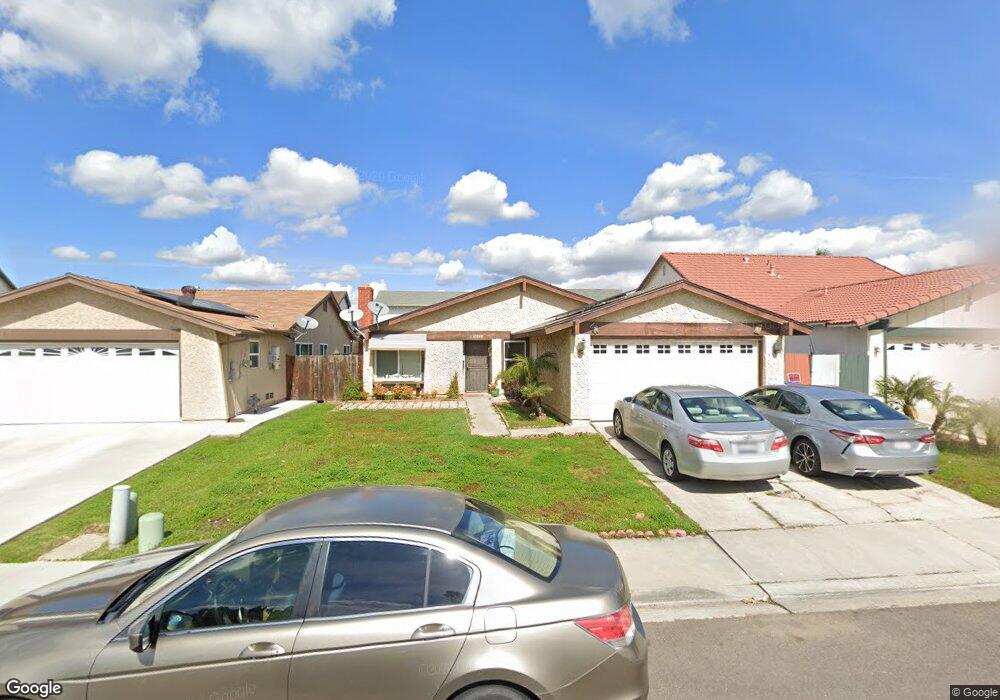
11040 Delphinus Way San Diego, CA 92126
Mira Mesa NeighborhoodEstimated Value: $1,027,054 - $1,143,000
4
Beds
2
Baths
1,320
Sq Ft
$818/Sq Ft
Est. Value
About This Home
This home is located at 11040 Delphinus Way, San Diego, CA 92126 and is currently estimated at $1,079,764, approximately $818 per square foot. 11040 Delphinus Way is a home located in San Diego County with nearby schools including Hage Elementary School, Wangenheim Middle School, and Mira Mesa High School.
Ownership History
Date
Name
Owned For
Owner Type
Purchase Details
Closed on
May 1, 2025
Sold by
Lok Michelle Jun
Bought by
Lok Michelle Jun
Current Estimated Value
Home Financials for this Owner
Home Financials are based on the most recent Mortgage that was taken out on this home.
Original Mortgage
$436,000
Outstanding Balance
$432,478
Interest Rate
6.65%
Mortgage Type
Credit Line Revolving
Estimated Equity
$647,286
Purchase Details
Closed on
Sep 22, 2021
Sold by
Mei Jason
Bought by
Lok Michelle Jun
Home Financials for this Owner
Home Financials are based on the most recent Mortgage that was taken out on this home.
Original Mortgage
$400,000
Interest Rate
2.8%
Mortgage Type
New Conventional
Purchase Details
Closed on
Sep 26, 2020
Sold by
Lok Ying and Lok Michelle Jun
Bought by
Lok Michelle Jun
Home Financials for this Owner
Home Financials are based on the most recent Mortgage that was taken out on this home.
Original Mortgage
$364,572
Interest Rate
2.9%
Mortgage Type
Credit Line Revolving
Purchase Details
Closed on
Aug 30, 2004
Sold by
Lok Ying
Bought by
Luo Jun
Purchase Details
Closed on
Mar 8, 2001
Sold by
Young David Andrew and Young Kathryn Mary
Bought by
Lok Ying
Home Financials for this Owner
Home Financials are based on the most recent Mortgage that was taken out on this home.
Original Mortgage
$199,600
Interest Rate
7.09%
Purchase Details
Closed on
Dec 1, 1998
Sold by
Andrew Young David and Mary Kathryn
Bought by
Young David Andrew and Young Kathryn Mary
Home Financials for this Owner
Home Financials are based on the most recent Mortgage that was taken out on this home.
Original Mortgage
$145,000
Interest Rate
6.78%
Purchase Details
Closed on
Aug 7, 1996
Sold by
Haffey Terrence M and Haffey Elizabeth E
Bought by
Young David Andrew and Haffey Kathryn Mary
Home Financials for this Owner
Home Financials are based on the most recent Mortgage that was taken out on this home.
Original Mortgage
$121,500
Interest Rate
6.25%
Purchase Details
Closed on
Dec 28, 1993
Sold by
Haffey Diane M
Bought by
Haffey Terrence M
Home Financials for this Owner
Home Financials are based on the most recent Mortgage that was taken out on this home.
Original Mortgage
$110,000
Interest Rate
7.38%
Purchase Details
Closed on
Dec 3, 1993
Sold by
Haffey Richard A and Crowe Maureen A
Bought by
Haffey Terrence M and Haffey Elizabeth E
Home Financials for this Owner
Home Financials are based on the most recent Mortgage that was taken out on this home.
Original Mortgage
$110,000
Interest Rate
7.38%
Create a Home Valuation Report for This Property
The Home Valuation Report is an in-depth analysis detailing your home's value as well as a comparison with similar homes in the area
Home Values in the Area
Average Home Value in this Area
Purchase History
| Date | Buyer | Sale Price | Title Company |
|---|---|---|---|
| Lok Michelle Jun | -- | None Listed On Document | |
| Lok Michelle Jun | -- | Lawyers Title Company | |
| Lok Michelle Jun | -- | Western Resources Title | |
| Luo Jun | $12,500 | -- | |
| Lok Ying | $249,500 | Fidelity National Title Co | |
| Young David Andrew | -- | Fidelity National Title Co | |
| Young David Andrew | $24,000 | Commonwealth Land Title Co | |
| Haffey Terrence M | -- | Commonwealth Land Title Co | |
| Haffey Terrence M | -- | Commonwealth Land Title Co |
Source: Public Records
Mortgage History
| Date | Status | Borrower | Loan Amount |
|---|---|---|---|
| Open | Lok Michelle Jun | $436,000 | |
| Previous Owner | Lok Michelle Jun | $400,000 | |
| Previous Owner | Lok Michelle Jun | $364,572 | |
| Previous Owner | Lok Ying | $199,600 | |
| Previous Owner | Young David Andrew | $145,000 | |
| Previous Owner | Young David Andrew | $121,500 | |
| Previous Owner | Haffey Terrence M | $110,000 |
Source: Public Records
Tax History Compared to Growth
Tax History
| Year | Tax Paid | Tax Assessment Tax Assessment Total Assessment is a certain percentage of the fair market value that is determined by local assessors to be the total taxable value of land and additions on the property. | Land | Improvement |
|---|---|---|---|---|
| 2025 | $8,072 | $673,191 | $520,765 | $152,426 |
| 2024 | $8,072 | $659,992 | $510,554 | $149,438 |
| 2023 | $7,892 | $647,052 | $500,544 | $146,508 |
| 2022 | $7,262 | $600,000 | $460,000 | $140,000 |
| 2021 | $6,068 | $495,583 | $332,145 | $163,438 |
| 2020 | $9,782 | $490,503 | $328,740 | $161,763 |
| 2019 | $9,651 | $480,887 | $322,295 | $158,592 |
| 2018 | $9,268 | $471,459 | $315,976 | $155,483 |
| 2017 | $5,366 | $462,216 | $309,781 | $152,435 |
| 2016 | $5,279 | $453,154 | $303,707 | $149,447 |
| 2015 | $5,200 | $446,349 | $299,146 | $147,203 |
| 2014 | $4,497 | $385,000 | $260,000 | $125,000 |
Source: Public Records
Map
Nearby Homes
- 8849 Capricorn Way
- 10805 Eberly Ct
- 8943 Calliandra Rd
- 9310 Galvin Ave Unit 15
- 11279 Pegasus Ave
- 8686 Perseus Rd
- 11091 Ice Skate Place Unit 20
- 8727 Westmore Rd Unit 24
- 8595 Summerdale Rd Unit 170
- 8669 Summerdale Rd
- 10770 Black Mountain Rd Unit 220
- 10770 Black Mountain Rd
- 11336 Camarosa Cir
- 9471 Compass Point Dr S
- 11394 Pegasus Ave
- 11368 Squamish Rd
- 10771 Black Mountain Rd Unit 58
- 8468 Calle Morelos
- 8485 Westmore Rd Unit 40
- 8644 New Salem St Unit 6
- 11044 Delphinus Way
- 11036 Delphinus Way
- 9045 Penticton Way
- 11048 Delphinus Way
- 9051 Penticton Way
- 11032 Delphinus Way
- 9039 Penticton Way
- 9057 Penticton Way
- 9033 Penticton Way
- 11052 Delphinus Way Unit 17
- 11033 Delphinus Way
- 11037 Delphinus Way
- 11028 Delphinus Way
- 11029 Delphinus Way
- 9063 Penticton Way
- 11041 Delphinus Way
- 9027 Penticton Way
- 11024 Delphinus Way
- 11056 Delphinus Way
- 11045 Delphinus Way