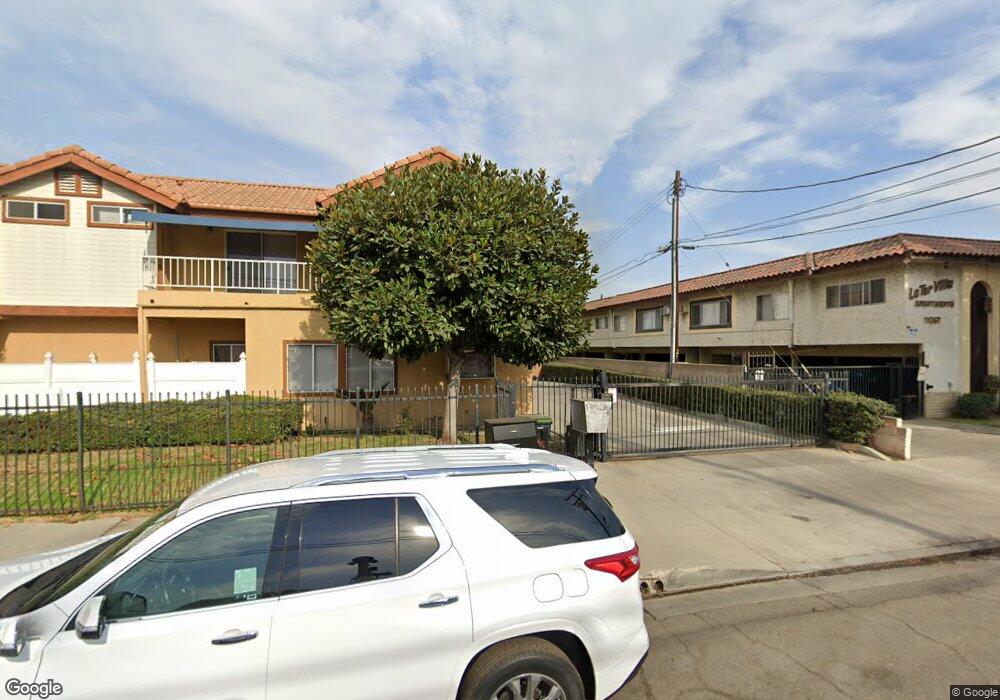
11043 Ferina St Unit A Norwalk, CA 90650
Estimated Value: $618,928 - $654,000
3
Beds
2
Baths
1,313
Sq Ft
$480/Sq Ft
Est. Value
About This Home
This home is located at 11043 Ferina St Unit A, Norwalk, CA 90650 and is currently estimated at $629,982, approximately $479 per square foot. 11043 Ferina St Unit A is a home located in Los Angeles County with nearby schools including Anna M. Glazier Elementary School, Los Alisos Middle School, and Norwalk High School.
Ownership History
Date
Name
Owned For
Owner Type
Purchase Details
Closed on
Jul 28, 2010
Sold by
U S Bank National Association
Bought by
Ly Kevin and Nguyen Thu Han Hoang
Current Estimated Value
Home Financials for this Owner
Home Financials are based on the most recent Mortgage that was taken out on this home.
Original Mortgage
$183,200
Outstanding Balance
$120,990
Interest Rate
4.52%
Mortgage Type
New Conventional
Estimated Equity
$508,992
Purchase Details
Closed on
Apr 23, 2010
Sold by
Peoples Dorian Anreia
Bought by
U S Bank National Association
Purchase Details
Closed on
Jun 29, 2006
Sold by
Block Donna
Bought by
Peoples Dorian Anreia
Home Financials for this Owner
Home Financials are based on the most recent Mortgage that was taken out on this home.
Original Mortgage
$333,600
Interest Rate
6.75%
Mortgage Type
Stand Alone First
Purchase Details
Closed on
Aug 18, 1995
Sold by
Wang Pei Li and Wang Shan
Bought by
Block Donna
Create a Home Valuation Report for This Property
The Home Valuation Report is an in-depth analysis detailing your home's value as well as a comparison with similar homes in the area
Home Values in the Area
Average Home Value in this Area
Purchase History
| Date | Buyer | Sale Price | Title Company |
|---|---|---|---|
| Ly Kevin | $229,000 | Lsi Title Agency | |
| U S Bank National Association | $252,152 | Accommodation | |
| Peoples Dorian Anreia | $417,000 | Old Republic Title | |
| Block Donna | $129,000 | Guardian Title Company |
Source: Public Records
Mortgage History
| Date | Status | Borrower | Loan Amount |
|---|---|---|---|
| Open | Ly Kevin | $183,200 | |
| Previous Owner | Peoples Dorian Anreia | $333,600 |
Source: Public Records
Tax History Compared to Growth
Tax History
| Year | Tax Paid | Tax Assessment Tax Assessment Total Assessment is a certain percentage of the fair market value that is determined by local assessors to be the total taxable value of land and additions on the property. | Land | Improvement |
|---|---|---|---|---|
| 2025 | $3,878 | $293,376 | $70,586 | $222,790 |
| 2024 | $3,878 | $287,624 | $69,202 | $218,422 |
| 2023 | $3,748 | $281,986 | $67,846 | $214,140 |
| 2022 | $3,680 | $276,458 | $66,516 | $209,942 |
| 2021 | $3,624 | $271,038 | $65,212 | $205,826 |
| 2019 | $3,519 | $263,001 | $63,279 | $199,722 |
| 2018 | $3,391 | $257,845 | $62,039 | $195,806 |
| 2016 | $3,241 | $247,834 | $59,631 | $188,203 |
| 2015 | $3,212 | $244,113 | $58,736 | $185,377 |
| 2014 | $2,994 | $239,332 | $57,586 | $181,746 |
Source: Public Records
Map
Nearby Homes
- 11051 Molette St
- 11113 Barnwall St
- 15412 Allingham Ave
- 15025 Graystone Ave
- 11302 Barnwall St
- 11343 Highdale St
- 14837 Piuma Ave
- 14508 Dumont Ave
- 14831 Domart Ave
- 11425 Hayford St
- 14119 Elmcroft Ave
- 15343 Carfax Ave
- 10446 Highdale St
- 10525 Somerset Blvd Unit 40
- 10525 Somerset Blvd Unit 45
- 13900 Studebaker Rd Unit 19
- 11712 Ferina St
- 14065 Bayside Dr
- 14004 Edgewater Dr
- 13927 Flatbush Ave
- 11045 Ferina St Unit B
- 11045 Ferina St Unit A
- 11043 Ferina St Unit B
- 11051 Ferina St
- 11049 Ferina St
- 11047 Ferina St
- 11053 Ferina St Unit B
- 11053 Ferina St Unit A
- 11051 Ferina St Unit B
- 11051 Ferina St Unit A
- 11049 Ferina St Unit B
- 11049 Ferina St Unit A
- 11047 Ferina St Unit B
- 11047 Ferina St Unit A
- 11037 Ferina St
- 11057 Ferina St
- 11057 Ferina St Unit 104
- 11057 Ferina St Unit 201
- 11025 Ferina St
- 15202 Allingham Ave