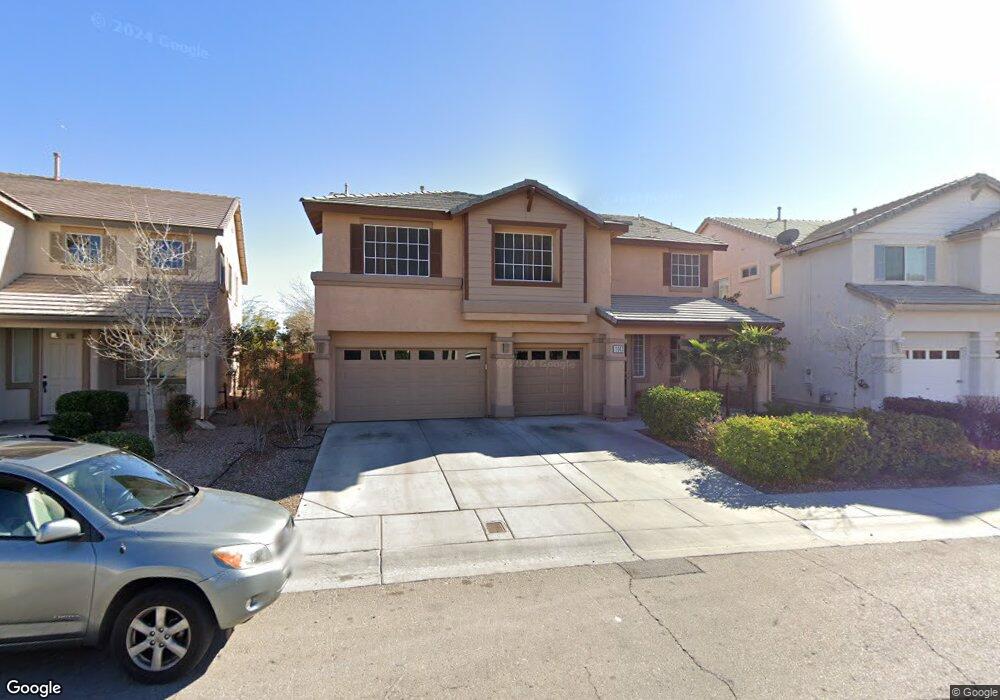
11043 Turlington Ln Las Vegas, NV 89135
Summerlin NeighborhoodEstimated Value: $728,721 - $789,000
5
Beds
3
Baths
3,023
Sq Ft
$253/Sq Ft
Est. Value
About This Home
This home is located at 11043 Turlington Ln, Las Vegas, NV 89135 and is currently estimated at $764,930, approximately $253 per square foot. 11043 Turlington Ln is a home located in Clark County with nearby schools including Judy & John L. Goolsby Elementary School, Victoria Fertitta Middle School, and Palo Verde High School.
Ownership History
Date
Name
Owned For
Owner Type
Purchase Details
Closed on
Apr 6, 2020
Sold by
Streater Anthony W and Streater Cheryl R
Bought by
Streater Anthony W
Current Estimated Value
Purchase Details
Closed on
Jan 23, 2002
Sold by
Kb Home Nevada Inc
Bought by
Streater Anthony W and Streater Cheryl R
Home Financials for this Owner
Home Financials are based on the most recent Mortgage that was taken out on this home.
Original Mortgage
$227,500
Outstanding Balance
$93,430
Interest Rate
7.11%
Estimated Equity
$671,500
Create a Home Valuation Report for This Property
The Home Valuation Report is an in-depth analysis detailing your home's value as well as a comparison with similar homes in the area
Home Values in the Area
Average Home Value in this Area
Purchase History
| Date | Buyer | Sale Price | Title Company |
|---|---|---|---|
| Streater Anthony W | -- | Stewart Title Company F | |
| Streater Anthony W | $239,494 | First American Title Co |
Source: Public Records
Mortgage History
| Date | Status | Borrower | Loan Amount |
|---|---|---|---|
| Open | Streater Anthony W | $227,500 |
Source: Public Records
Tax History Compared to Growth
Tax History
| Year | Tax Paid | Tax Assessment Tax Assessment Total Assessment is a certain percentage of the fair market value that is determined by local assessors to be the total taxable value of land and additions on the property. | Land | Improvement |
|---|---|---|---|---|
| 2025 | $3,466 | $177,532 | $77,700 | $99,832 |
| 2024 | $3,366 | $177,532 | $77,700 | $99,832 |
| 2023 | $2,667 | $148,558 | $53,900 | $94,658 |
| 2022 | $3,268 | $130,847 | $44,450 | $86,397 |
| 2021 | $3,171 | $122,695 | $40,600 | $82,095 |
| 2020 | $3,076 | $120,953 | $39,550 | $81,403 |
| 2019 | $2,986 | $118,361 | $38,150 | $80,211 |
| 2018 | $2,849 | $108,477 | $32,200 | $76,277 |
| 2017 | $2,667 | $105,031 | $28,000 | $77,031 |
| 2016 | $2,667 | $102,492 | $25,550 | $76,942 |
| 2015 | $2,662 | $94,839 | $22,050 | $72,789 |
| 2014 | $2,584 | $92,957 | $15,750 | $77,207 |
Source: Public Records
Map
Nearby Homes
- 3215 Orange Sun St
- 3236 Rushing Waters Place
- 3257 Rushing Waters Place
- 11033 Ashboro Ave
- 11026 Ashboro Ave
- 10968 Tranquil Waters Ct
- 3302 Saddle Soap Ct
- 10829 Ickworth Ct
- 3040 American River Ln
- 2951 Brighton Creek Ct
- 11251 La Madre Ridge Dr
- 11053 Zarod Rd
- 2933 Red Springs Dr
- 10799 Flame Vine Ct
- 2952 Soft Horizon Way
- 2885 Red Springs Dr
- 2967 Soft Horizon Way
- 10717 Refectory Ave
- 2922 Soft Horizon Way
- 3074 Soft Horizon Way
- 11037 Turlington Ln Unit n/a
- 11037 Turlington Ln
- 11037 Turlington Ln Unit 9999
- 11037 Turlington Ln Unit 999
- 11049 Turlington Ln
- 11106 Harvest Hill Ln
- 11055 Turlington Ln
- 11031 Turlington Ln
- 11100 Harvest Hill Ln
- 11112 Harvest Hill Ln
- 11112 Harvest Hill Ln Unit n/a
- 10996 Harvest Hill Ln
- 10996 Harvest Hill Ln
- 11118 Harvest Hill Ln
- 10992 Harvest Hill Ln
- 11044 Turlington Ln
- 11036 Turlington Ln
- 11061 Turlington Ln
- 11025 Turlington Ln
- 11052 Turlington Ln