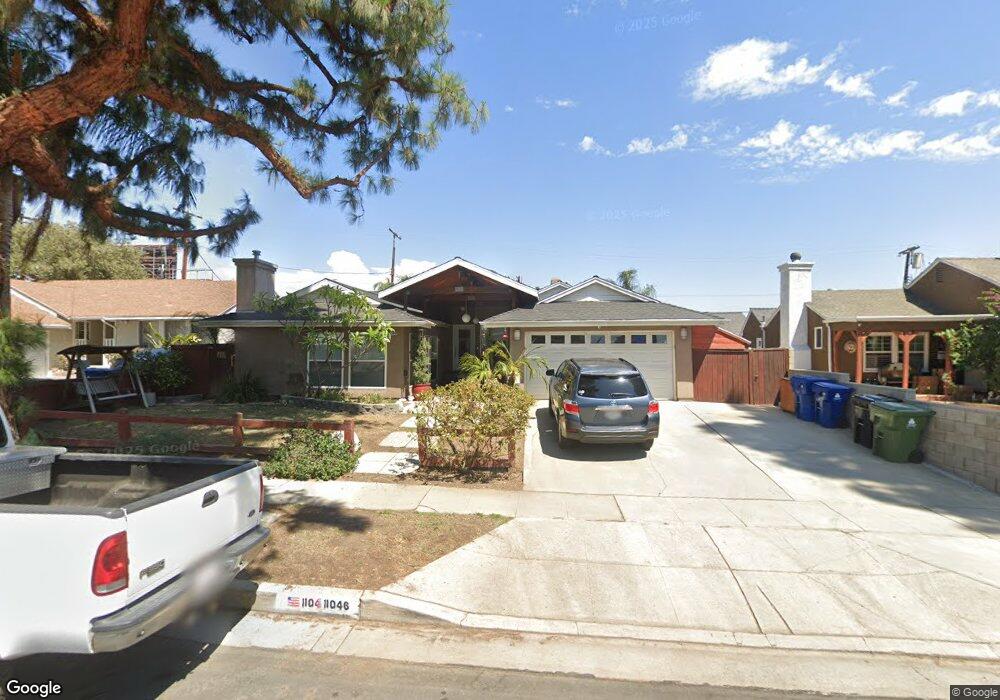
11046 Paso Robles Ave Granada Hills, CA 91344
Estimated Value: $1,010,000 - $1,189,000
3
Beds
3
Baths
1,965
Sq Ft
$543/Sq Ft
Est. Value
About This Home
This home is located at 11046 Paso Robles Ave, Granada Hills, CA 91344 and is currently estimated at $1,066,043, approximately $542 per square foot. 11046 Paso Robles Ave is a home located in Los Angeles County with nearby schools including Granada Elementary School for Advanced Studies, Patrick Henry Middle School, and Valley Academy of Arts & Sciences.
Ownership History
Date
Name
Owned For
Owner Type
Purchase Details
Closed on
Jun 7, 2000
Sold by
Barnett James
Bought by
Flores Joel and Flores Tracy G
Current Estimated Value
Home Financials for this Owner
Home Financials are based on the most recent Mortgage that was taken out on this home.
Original Mortgage
$177,536
Outstanding Balance
$64,593
Interest Rate
8.67%
Mortgage Type
FHA
Estimated Equity
$1,001,450
Purchase Details
Closed on
Dec 10, 1996
Sold by
Fidelity Federal Bank Fsb
Bought by
Barnett James and Barnett Julia
Home Financials for this Owner
Home Financials are based on the most recent Mortgage that was taken out on this home.
Original Mortgage
$78,400
Interest Rate
7.59%
Mortgage Type
FHA
Purchase Details
Closed on
Apr 9, 1996
Sold by
Senft Gale
Bought by
Fidelity Federal Bank Fsb
Create a Home Valuation Report for This Property
The Home Valuation Report is an in-depth analysis detailing your home's value as well as a comparison with similar homes in the area
Home Values in the Area
Average Home Value in this Area
Purchase History
| Date | Buyer | Sale Price | Title Company |
|---|---|---|---|
| Flores Joel | $179,000 | Southland Title Corporation | |
| Barnett James | $117,500 | North American Title Company | |
| Fidelity Federal Bank Fsb | $142,694 | American Title Ins Co |
Source: Public Records
Mortgage History
| Date | Status | Borrower | Loan Amount |
|---|---|---|---|
| Open | Flores Joel | $177,536 | |
| Previous Owner | Barnett James | $78,400 |
Source: Public Records
Tax History Compared to Growth
Tax History
| Year | Tax Paid | Tax Assessment Tax Assessment Total Assessment is a certain percentage of the fair market value that is determined by local assessors to be the total taxable value of land and additions on the property. | Land | Improvement |
|---|---|---|---|---|
| 2025 | $5,137 | $409,867 | $180,426 | $229,441 |
| 2024 | $5,137 | $401,832 | $176,889 | $224,943 |
| 2023 | $5,041 | $393,954 | $173,421 | $220,533 |
| 2022 | $4,814 | $386,230 | $170,021 | $216,209 |
| 2021 | $4,747 | $378,658 | $166,688 | $211,970 |
| 2019 | $4,608 | $336,217 | $161,745 | $174,472 |
| 2018 | $4,130 | $329,625 | $158,574 | $171,051 |
| 2016 | $3,930 | $316,827 | $152,417 | $164,410 |
| 2015 | $3,874 | $312,069 | $150,128 | $161,941 |
| 2014 | $3,893 | $305,957 | $147,188 | $158,769 |
Source: Public Records
Map
Nearby Homes
- 17062 San Fernando Mission Blvd
- 17043 Celtic St
- 17068 Celtic St
- 16857 San Fernando Mission Blvd Unit 24
- 16857 San Fernando Mission Blvd Unit 44
- 16870 Tulsa St
- 17257 Horace St
- 16857 Chatsworth St
- 16940 Chatsworth St Unit 208
- 17175 Chatsworth St
- 17014 Rinaldi St
- 16712 Tribune St
- 16814 Rinaldi St
- 17317 Los Alimos St
- 16701 Kalisher St
- 10752 Gerald Ave
- 17230 Chatsworth St Unit 1
- 16609 Chatsworth St
- 17222 Kingsbury St
- 10501 Forbes Ave
- 11054 Paso Robles Ave
- 11040 Paso Robles Ave
- 11060 Paso Robles Ave
- 11034 Paso Robles Ave
- 11059 Balboa Blvd
- 11047 Paso Robles Ave
- 11031 Balboa Blvd
- 11041 Paso Robles Ave
- 17030 S f Mission Blvd
- 11028 Paso Robles Ave
- 17031 Ludlow St
- 11025 Balboa Blvd
- 17038 San Fernando Mission Blvd
- 17038 S f Mission Blvd
- 11042 Pender Ave
- 11024 Paso Robles Ave
- 17039 Ludlow St
- 17044 S f Mission Blvd
- 17044 San Fernando Mission Blvd
- 17046 San Fernando Mission Blvd