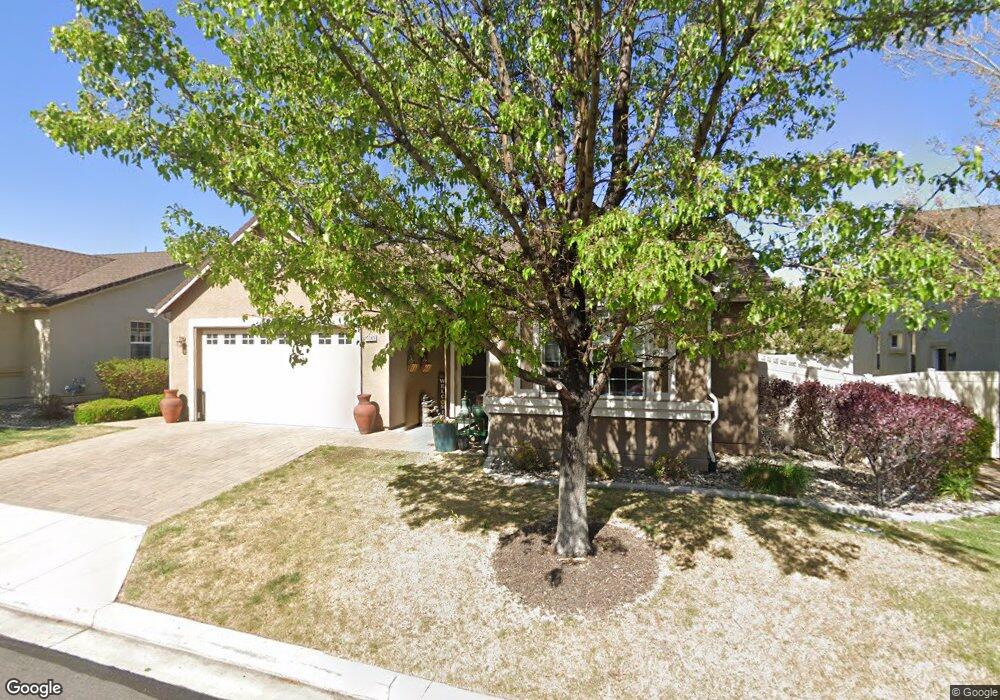
11049 Colton Dr Reno, NV 89521
Virginia Foothills NeighborhoodEstimated Value: $582,000 - $626,000
3
Beds
2
Baths
1,564
Sq Ft
$387/Sq Ft
Est. Value
About This Home
This home is located at 11049 Colton Dr, Reno, NV 89521 and is currently estimated at $605,307, approximately $387 per square foot. 11049 Colton Dr is a home located in Washoe County with nearby schools including Jwood Raw Elementary School, Kendyl Depoali Middle School, and Damonte Ranch High School.
Ownership History
Date
Name
Owned For
Owner Type
Purchase Details
Closed on
Apr 21, 2021
Sold by
Fanlo Onetta J and Fanlo Thomas P
Bought by
Fanlo Onetta J and Fanlo Thomas P
Current Estimated Value
Home Financials for this Owner
Home Financials are based on the most recent Mortgage that was taken out on this home.
Original Mortgage
$140,000
Outstanding Balance
$126,403
Interest Rate
3%
Mortgage Type
New Conventional
Estimated Equity
$478,904
Purchase Details
Closed on
Apr 15, 2011
Sold by
Fanlo Thomas P and Fanlo Onetta J
Bought by
Fanlo Thomas P and Fanlo Onetta J
Home Financials for this Owner
Home Financials are based on the most recent Mortgage that was taken out on this home.
Original Mortgage
$161,120
Interest Rate
4.83%
Mortgage Type
New Conventional
Purchase Details
Closed on
Apr 7, 2011
Sold by
Dh1 Llc
Bought by
Fanlo Thomas P and Fanlo Onetta J
Home Financials for this Owner
Home Financials are based on the most recent Mortgage that was taken out on this home.
Original Mortgage
$161,120
Interest Rate
4.83%
Mortgage Type
New Conventional
Create a Home Valuation Report for This Property
The Home Valuation Report is an in-depth analysis detailing your home's value as well as a comparison with similar homes in the area
Home Values in the Area
Average Home Value in this Area
Purchase History
| Date | Buyer | Sale Price | Title Company |
|---|---|---|---|
| Fanlo Onetta J | -- | Amrock Llc | |
| Fanlo Onetta J | -- | Amrock Llc | |
| Fanlo Thomas P | -- | Western Title Company | |
| Fanlo Thomas P | $201,500 | Western Title Company |
Source: Public Records
Mortgage History
| Date | Status | Borrower | Loan Amount |
|---|---|---|---|
| Open | Fanlo Onetta J | $140,000 | |
| Closed | Fanlo Thomas P | $161,120 |
Source: Public Records
Tax History Compared to Growth
Tax History
| Year | Tax Paid | Tax Assessment Tax Assessment Total Assessment is a certain percentage of the fair market value that is determined by local assessors to be the total taxable value of land and additions on the property. | Land | Improvement |
|---|---|---|---|---|
| 2025 | $3,223 | $125,676 | $45,150 | $80,526 |
| 2024 | $3,223 | $123,475 | $42,700 | $80,775 |
| 2023 | $3,130 | $118,799 | $42,700 | $76,099 |
| 2022 | $3,039 | $99,154 | $35,910 | $63,244 |
| 2021 | $2,923 | $92,874 | $31,500 | $61,374 |
| 2020 | $2,838 | $92,761 | $31,500 | $61,261 |
| 2019 | $2,754 | $88,172 | $29,015 | $59,157 |
| 2018 | $2,670 | $78,005 | $20,405 | $57,600 |
| 2017 | $2,596 | $77,596 | $20,090 | $57,506 |
| 2016 | $2,530 | $76,527 | $17,920 | $58,607 |
| 2015 | $2,526 | $75,152 | $16,765 | $58,387 |
| 2014 | $2,456 | $70,391 | $14,385 | $56,006 |
| 2013 | -- | $64,571 | $12,530 | $52,041 |
Source: Public Records
Map
Nearby Homes
- 11020 Colton Dr
- 11039 Lamour Ln
- 1811 Stetson Dr
- 1876 Braemore Dr
- 11129 Bandero Heights Ln
- 10900 Serratina Dr Unit 22
- 40S Se4nw4-S16 18n 21e
- 40S Nw4sw4-S16 18n 21e
- 40S Sw4nw4-S16 18n 21e
- 40S Nw4nw4-S16 18n 21e
- 10885 Pentwater Dr
- 11204 Freedom Range Ln
- 10643 Brittany Park Dr
- 11135 Messina Way
- 0 Double Diamond Pkwy Unit 210005046
- 0 Double Diamond Pkwy Unit 210005044
- 0 Geiger Grade Unit 250053963
- 0 Us Hwy 395 S Unit 240002170
- 10677 Foxberry Park Dr
- 0 Cinder Ln Unit 250001294
- 9267 Blue Hills Trail
- 11057 Colton Dr
- 11045 Colton Dr
- 11048 Colton Dr
- 11050 Lamour Ln
- 11048 Lamour Ln
- 11052 Lamour Ln
- 11052 Colton Dr
- 11054 Lamour Ln
- 11044 Colton Dr
- 11046 Lamour Ln
- 11043 Colton Dr Unit 20A
- 11061 Colton Dr
- 11056 Colton Dr
- 11040 Colton Dr Unit 20A
- 11041 Colton Dr
- 11058 Lamour Ln
- 11042 Lamour Ln
- 1860 Thousand Acres Way Unit 20A
- 11038 Colton Dr