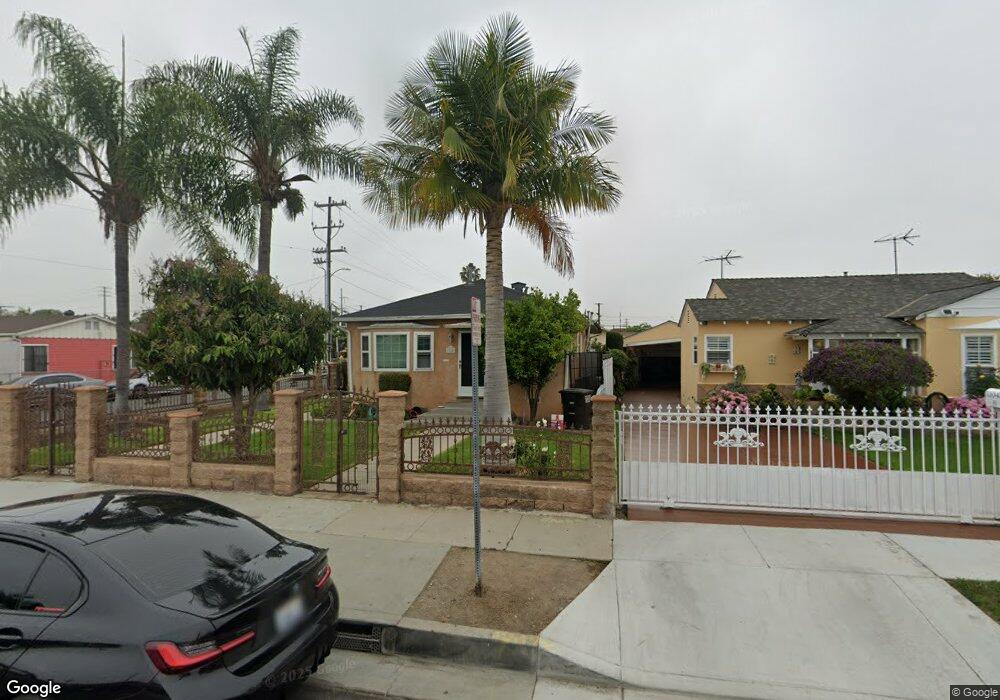
11049 Condon Ave Inglewood, CA 90304
Lennox NeighborhoodEstimated Value: $771,000 - $900,000
5
Beds
3
Baths
1,828
Sq Ft
$448/Sq Ft
Est. Value
About This Home
This home is located at 11049 Condon Ave, Inglewood, CA 90304 and is currently estimated at $818,961, approximately $448 per square foot. 11049 Condon Ave is a home located in Los Angeles County with nearby schools including Buford Elementary School, Lennox Middle School, and Hawthorne High School.
Ownership History
Date
Name
Owned For
Owner Type
Purchase Details
Closed on
Mar 9, 2023
Sold by
Jauregui Maximino Sandoval and Jauregui Maximino
Bought by
Maximino & Rosa Sandoval Family Living Trust
Current Estimated Value
Purchase Details
Closed on
Sep 20, 2001
Sold by
Sandoval Maximino
Bought by
Sandoval Maximino and Sandoval Rosa
Home Financials for this Owner
Home Financials are based on the most recent Mortgage that was taken out on this home.
Original Mortgage
$104,889
Interest Rate
6.88%
Purchase Details
Closed on
Mar 2, 2000
Sold by
Flores Jose L
Bought by
Sandoval Maximino and Sandoval Jacinto
Home Financials for this Owner
Home Financials are based on the most recent Mortgage that was taken out on this home.
Original Mortgage
$124,000
Interest Rate
8.22%
Create a Home Valuation Report for This Property
The Home Valuation Report is an in-depth analysis detailing your home's value as well as a comparison with similar homes in the area
Home Values in the Area
Average Home Value in this Area
Purchase History
| Date | Buyer | Sale Price | Title Company |
|---|---|---|---|
| Maximino & Rosa Sandoval Family Living Trust | -- | -- | |
| Sandoval Maximino | -- | -- | |
| Sandoval Maximino | $155,000 | American Title Co |
Source: Public Records
Mortgage History
| Date | Status | Borrower | Loan Amount |
|---|---|---|---|
| Previous Owner | Sandoval Maximino | $104,889 | |
| Previous Owner | Sandoval Maximino | $124,000 | |
| Closed | Sandoval Maximino | $50,000 |
Source: Public Records
Tax History Compared to Growth
Tax History
| Year | Tax Paid | Tax Assessment Tax Assessment Total Assessment is a certain percentage of the fair market value that is determined by local assessors to be the total taxable value of land and additions on the property. | Land | Improvement |
|---|---|---|---|---|
| 2025 | $5,999 | $311,778 | $185,927 | $125,851 |
| 2024 | $5,999 | $305,666 | $182,282 | $123,384 |
| 2023 | $5,715 | $299,673 | $178,708 | $120,965 |
| 2022 | $5,629 | $293,798 | $175,204 | $118,594 |
| 2021 | $5,425 | $288,038 | $171,769 | $116,269 |
| 2019 | $4,942 | $279,496 | $166,675 | $112,821 |
| 2018 | $4,798 | $274,016 | $163,407 | $110,609 |
| 2016 | $4,376 | $263,377 | $157,062 | $106,315 |
| 2015 | $4,264 | $259,422 | $154,703 | $104,719 |
| 2014 | $4,244 | $254,341 | $151,673 | $102,668 |
Source: Public Records
Map
Nearby Homes
- 10905 Dalerose Ave
- 11031 S Burin Ave
- 10910 S Burl Ave
- 4505 Lennox Blvd
- 4900 Lennox Blvd
- 11521 Inglewood Ave
- 11620 Inglewood Ave
- 4703 W 118th St
- 11319 Larch Ave
- 10333 S Inglewood Ave
- 4341 W 106th St
- 4322 W 106th St
- 11835 Gale Ave
- 11830 Manor Dr Unit A
- 11537 Birch Ave
- 4323 W 105th St
- 4845 W 118th Place Unit 2
- 11894 Truro Ave
- 4136 W 111th St
- 4817 W 119th St
- 11045 Condon Ave
- 11039 Condon Ave
- 4713 W 111th St
- 11101 Condon Ave
- 4717 W 111th St
- 4708 W 111th St
- 11033 Condon Ave
- 4710 W 111th St
- 11109 Condon Ave
- 4721 W 111th St
- 11102 Dalerose Ave
- 11048 Condon Ave
- 11044 Condon Ave
- 4656 W 111th St
- 11040 Condon Ave
- 11104 Dalerose Ave
- 11029 Condon Ave
- 4725 W 111th St
- 11113 Condon Ave
- 11027 Condon Ave