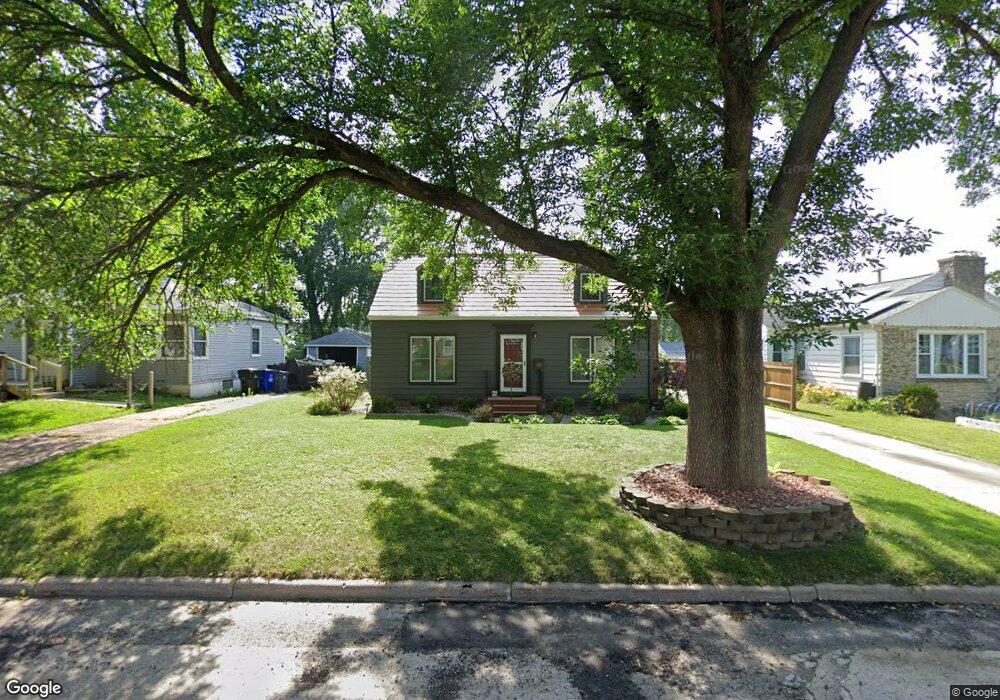
1105 25th St SE Cedar Rapids, IA 52403
Estimated Value: $182,753 - $197,000
2
Beds
2
Baths
1,166
Sq Ft
$161/Sq Ft
Est. Value
About This Home
This home is located at 1105 25th St SE, Cedar Rapids, IA 52403 and is currently estimated at $187,188, approximately $160 per square foot. 1105 25th St SE is a home located in Linn County with nearby schools including Grant Wood Elementary School, Summit Elementary School, and McKinley STEAM Academy.
Ownership History
Date
Name
Owned For
Owner Type
Purchase Details
Closed on
Nov 6, 2015
Sold by
Frederick Susan M and Deal Susan M
Bought by
Deal Kevin J
Current Estimated Value
Purchase Details
Closed on
Sep 29, 2006
Sold by
Hill Marth Sue
Bought by
Deal Kevin J
Purchase Details
Closed on
Jun 10, 2002
Sold by
Lovetinsky Klein Nathan A and Lovetinsky Klein Terri K
Bought by
Guerra Peter J
Home Financials for this Owner
Home Financials are based on the most recent Mortgage that was taken out on this home.
Original Mortgage
$87,000
Interest Rate
6.87%
Purchase Details
Closed on
Apr 23, 1999
Sold by
Warner Kevin W
Bought by
Klein Nathan A and Lovetinsky Terri K
Home Financials for this Owner
Home Financials are based on the most recent Mortgage that was taken out on this home.
Original Mortgage
$82,873
Interest Rate
7.05%
Mortgage Type
FHA
Create a Home Valuation Report for This Property
The Home Valuation Report is an in-depth analysis detailing your home's value as well as a comparison with similar homes in the area
Home Values in the Area
Average Home Value in this Area
Purchase History
| Date | Buyer | Sale Price | Title Company |
|---|---|---|---|
| Deal Kevin J | -- | None Available | |
| Deal Kevin J | $117,500 | None Available | |
| Guerra Peter J | $94,500 | -- | |
| Klein Nathan A | $82,500 | -- |
Source: Public Records
Mortgage History
| Date | Status | Borrower | Loan Amount |
|---|---|---|---|
| Previous Owner | Guerra Peter J | $87,000 | |
| Previous Owner | Klein Nathan A | $82,873 |
Source: Public Records
Tax History Compared to Growth
Tax History
| Year | Tax Paid | Tax Assessment Tax Assessment Total Assessment is a certain percentage of the fair market value that is determined by local assessors to be the total taxable value of land and additions on the property. | Land | Improvement |
|---|---|---|---|---|
| 2025 | $2,666 | $191,800 | $33,800 | $158,000 |
| 2024 | $2,704 | $167,600 | $31,100 | $136,500 |
| 2023 | $2,704 | $161,100 | $31,100 | $130,000 |
| 2022 | $2,586 | $137,100 | $27,000 | $110,100 |
| 2021 | $2,724 | $133,800 | $27,000 | $106,800 |
| 2020 | $2,724 | $132,100 | $27,000 | $105,100 |
| 2019 | $2,402 | $120,000 | $23,000 | $97,000 |
| 2018 | $2,332 | $120,000 | $23,000 | $97,000 |
| 2017 | $2,429 | $114,300 | $23,000 | $91,300 |
| 2016 | $2,429 | $114,300 | $23,000 | $91,300 |
| 2015 | $2,244 | $114,632 | $27,000 | $87,632 |
| 2014 | $2,254 | $114,632 | $27,000 | $87,632 |
| 2013 | $2,202 | $114,632 | $27,000 | $87,632 |
Source: Public Records
Map
Nearby Homes
- 2420 11th Ave SE
- 914 25th St SE
- 2600 Mount Vernon Rd SE
- 705 Grant Wood Dr SE
- 654 26th St SE
- 637 Grant Wood Dr SE
- 549 Vernon Dr SE
- 700 Memorial Dr SE
- 1158 28th St SE
- 1117 Crestview Dr SE
- 1135 Crestview Dr SE
- 1052 20th St SE
- 505 Forest Dr SE
- 2700 Mount Vernon Rd SE
- 2323 Upland Dr SE
- 1929 Ridgeway Dr SE
- 435 Forest Dr SE
- 510 Knollwood Dr SE
- 520 22nd St SE
- 1946 Higley Ave SE
- 1101 25th St SE
- 1109 25th St SE
- 1118 Forest Dr SE
- 1115 25th St SE
- 1120 Forest Dr SE
- 1100 Forest Dr SE
- 1122 Forest Dr SE
- 1108 25th St SE
- 1100 25th St SE
- 1114 25th St SE
- 1125 25th St SE
- 1001 25th St SE
- 1006 25th St SE
- 1118 25th St SE
- 1129 25th St SE
- 1122 25th St SE
- 935 25th St SE
- 1000 25th St SE
- 2435 12th Ave SE
- 2450 11th Ave SE