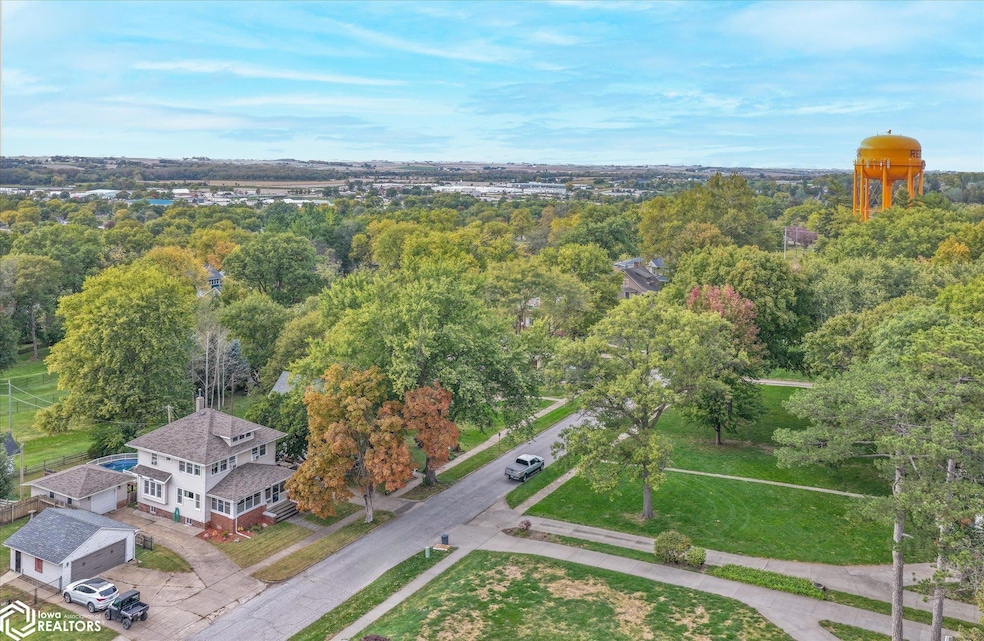
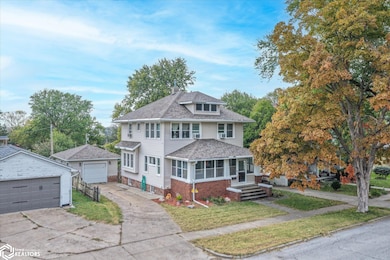
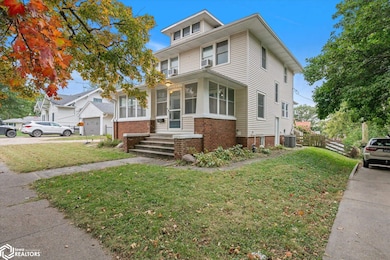
1105 Boundary St Red Oak, IA 51566
Estimated payment $1,509/month
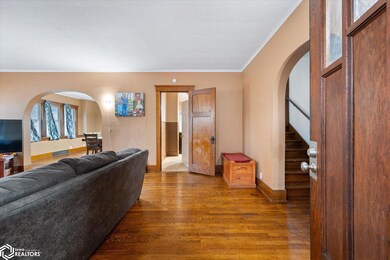
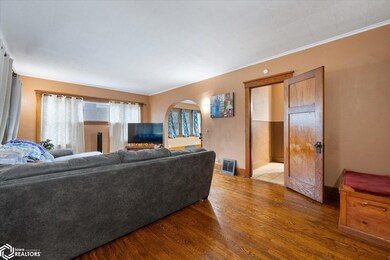
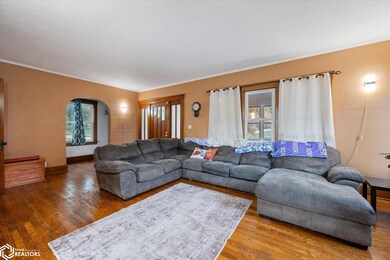
About This Home
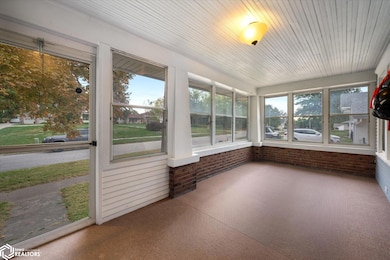
This spacious home features 4 bedrooms, 13⁄4 baths, and a brand new $13K furnace and A/C installed. Enjoy the 27-ft above-ground pool perfect for summer fun and and detached garage for vehicle or extra storage. Move-in ready with major updates already done! All this in a great location. Make your appointment today to view this home!
Home Details
Home Type
- Single Family
Est. Annual Taxes
- $4,020
Year Built
- Built in 1920
Parking
- 1
Additional Features
- Basement Fills Entire Space Under The House
- Lot Dimensions are 60.00 x 140.00
- Forced Air Heating System
Map
Home Values in the Area
Average Home Value in this Area
Tax History
| Year | Tax Paid | Tax Assessment Tax Assessment Total Assessment is a certain percentage of the fair market value that is determined by local assessors to be the total taxable value of land and additions on the property. | Land | Improvement |
|---|---|---|---|---|
| 2025 | $4,020 | $186,470 | $12,600 | $173,870 |
| 2024 | $4,020 | $171,310 | $9,450 | $161,860 |
| 2023 | $3,896 | $171,310 | $9,450 | $161,860 |
| 2022 | $3,662 | $144,470 | $9,450 | $135,020 |
| 2021 | $3,522 | $144,470 | $9,450 | $135,020 |
| 2020 | $3,522 | $132,190 | $9,450 | $122,740 |
| 2019 | $3,158 | $132,190 | $9,450 | $122,740 |
| 2018 | $2,814 | $119,920 | $0 | $0 |
| 2017 | $2,814 | $119,920 | $0 | $0 |
| 2015 | $2,870 | $119,920 | $0 | $0 |
| 2014 | $2,674 | $108,000 | $0 | $0 |
Property History
| Date | Event | Price | List to Sale | Price per Sq Ft | Prior Sale |
|---|---|---|---|---|---|
| 09/13/2025 09/13/25 | Price Changed | $224,000 | -1.7% | $128 / Sq Ft | |
| 09/04/2025 09/04/25 | Price Changed | $227,900 | -5.0% | $130 / Sq Ft | |
| 07/31/2025 07/31/25 | For Sale | $239,900 | +77.7% | $137 / Sq Ft | |
| 01/23/2018 01/23/18 | Sold | $135,000 | 0.0% | $77 / Sq Ft | View Prior Sale |
| 11/29/2017 11/29/17 | Pending | -- | -- | -- | |
| 10/04/2017 10/04/17 | For Sale | $135,000 | +6.3% | $77 / Sq Ft | |
| 04/17/2017 04/17/17 | Sold | $127,000 | -1.6% | $72 / Sq Ft | View Prior Sale |
| 03/13/2017 03/13/17 | Pending | -- | -- | -- | |
| 03/09/2017 03/09/17 | For Sale | $129,000 | +5.7% | $73 / Sq Ft | |
| 06/26/2014 06/26/14 | Sold | $122,000 | -26.0% | $69 / Sq Ft | View Prior Sale |
| 05/27/2014 05/27/14 | Pending | -- | -- | -- | |
| 04/17/2013 04/17/13 | For Sale | $164,900 | -- | $94 / Sq Ft |
Purchase History
| Date | Type | Sale Price | Title Company |
|---|---|---|---|
| Warranty Deed | $134,500 | -- | |
| Warranty Deed | $127,000 | None Available | |
| Warranty Deed | $67,000 | None Available |
Mortgage History
| Date | Status | Loan Amount | Loan Type |
|---|---|---|---|
| Open | $132,554 | FHA | |
| Previous Owner | $12,700 | New Conventional | |
| Previous Owner | $67,000 | New Conventional |
Source: NoCoast MLS
MLS Number: NOC6330351
APN: 600-62-82-010360-00
Disclaimer: Certain information contained herein is derived from information provided by parties other than Homes.com. All information provided is deemed reliable, but is not guaranteed to be accurate and should be independently verified.
![]() IDX information is provided exclusively for personal, non-commercial use, and may not be used for any purpose other than to identify prospective properties consumers may be interested in purchasing.
IDX information is provided exclusively for personal, non-commercial use, and may not be used for any purpose other than to identify prospective properties consumers may be interested in purchasing.
Information is deemed reliable but not guaranteed.
- 1109 N 8th St
- 1020 E Valley St
- 709 E Maple St
- 911 E Corning St
- 1010 N 6th St
- 703 E Oak St
- 1207 E Valley St
- 1012 E Corning St
- 1407 N 8th St
- 1408 Miller Ave
- 904 N 6th St
- 1303 Summit Parcel B St
- 811 Highland Ave
- 606 Carter Dr
- 1303 Summit Parcel A St
- 1007 E Reed St
- 407 E Prospect St
- 511 N Broad St
- 611 E Reed St
- 706 E Reed St
