Estimated Value: $110,575 - $199,000
--
Bed
--
Bath
860
Sq Ft
$168/Sq Ft
Est. Value
About This Home
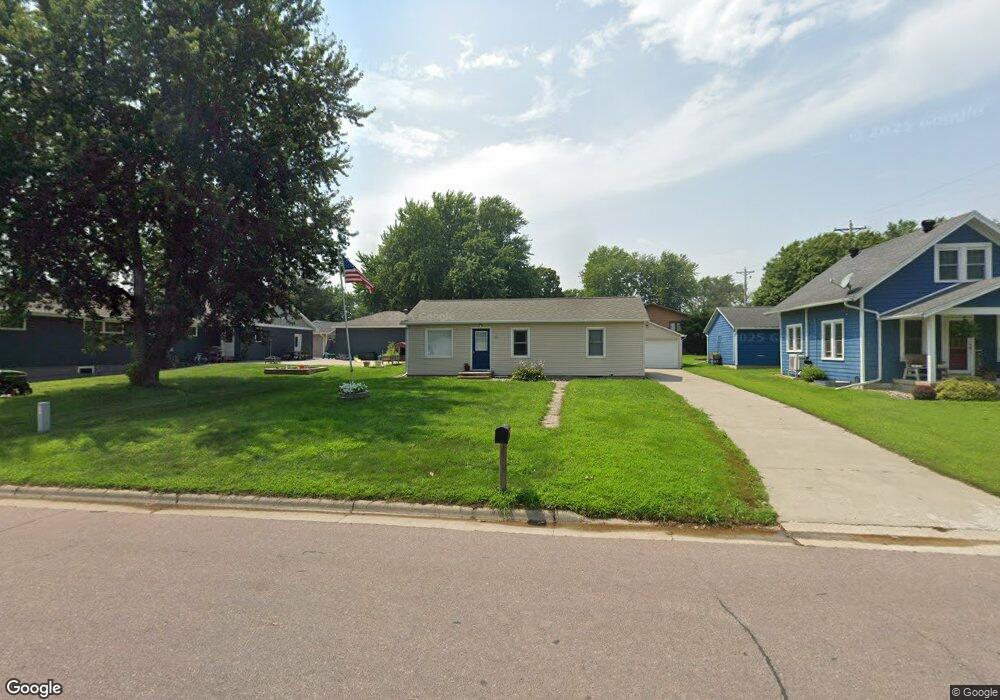
This home is located at 1105 Brown St, Hull, IA 51239 and is currently estimated at $144,144, approximately $167 per square foot. 1105 Brown St is a home located in Sioux County with nearby schools including Boyden-Hull Elementary School, Boyden-Hull High School, and Hull Christian School.
Ownership History
Date
Name
Owned For
Owner Type
Purchase Details
Closed on
Jan 7, 2025
Sold by
Walgenbach Cade
Bought by
Den Hartog John G and Den Hartog Jeanne
Current Estimated Value
Purchase Details
Closed on
May 20, 2019
Sold by
J & I Rentals Llc
Bought by
Cruise De-Groot
Home Financials for this Owner
Home Financials are based on the most recent Mortgage that was taken out on this home.
Original Mortgage
$58,800
Interest Rate
4.2%
Mortgage Type
New Conventional
Purchase Details
Closed on
Mar 25, 2005
Sold by
Deyager Stan J and De Yager Diana L
Bought by
Thao Cathi Hau
Home Financials for this Owner
Home Financials are based on the most recent Mortgage that was taken out on this home.
Original Mortgage
$16,148
Interest Rate
5.88%
Mortgage Type
New Conventional
Create a Home Valuation Report for This Property
The Home Valuation Report is an in-depth analysis detailing your home's value as well as a comparison with similar homes in the area
Home Values in the Area
Average Home Value in this Area
Purchase History
| Date | Buyer | Sale Price | Title Company |
|---|---|---|---|
| Den Hartog John G | $194,500 | None Listed On Document | |
| Den Hartog John G | $194,500 | None Listed On Document | |
| Cruise De-Groot | $73,500 | -- | |
| Thao Cathi Hau | $29,000 | None Available |
Source: Public Records
Mortgage History
| Date | Status | Borrower | Loan Amount |
|---|---|---|---|
| Previous Owner | Cruise De-Groot | $58,800 | |
| Previous Owner | Thao Cathi Hau | $16,148 |
Source: Public Records
Tax History Compared to Growth
Tax History
| Year | Tax Paid | Tax Assessment Tax Assessment Total Assessment is a certain percentage of the fair market value that is determined by local assessors to be the total taxable value of land and additions on the property. | Land | Improvement |
|---|---|---|---|---|
| 2025 | $1,236 | $95,650 | $13,960 | $81,690 |
| 2024 | $1,236 | $81,390 | $13,960 | $67,430 |
| 2023 | $1,218 | $81,390 | $13,960 | $67,430 |
| 2022 | $1,214 | $70,570 | $13,960 | $56,610 |
| 2021 | $1,166 | $70,270 | $13,960 | $56,310 |
| 2020 | $1,166 | $64,230 | $13,960 | $50,270 |
| 2019 | $972 | $52,850 | $7,760 | $45,090 |
| 2018 | $992 | $52,850 | $7,760 | $45,090 |
| 2017 | $992 | $52,850 | $7,760 | $45,090 |
| 2014 | $828 | $44,590 | $0 | $0 |
Source: Public Records
Map
Nearby Homes