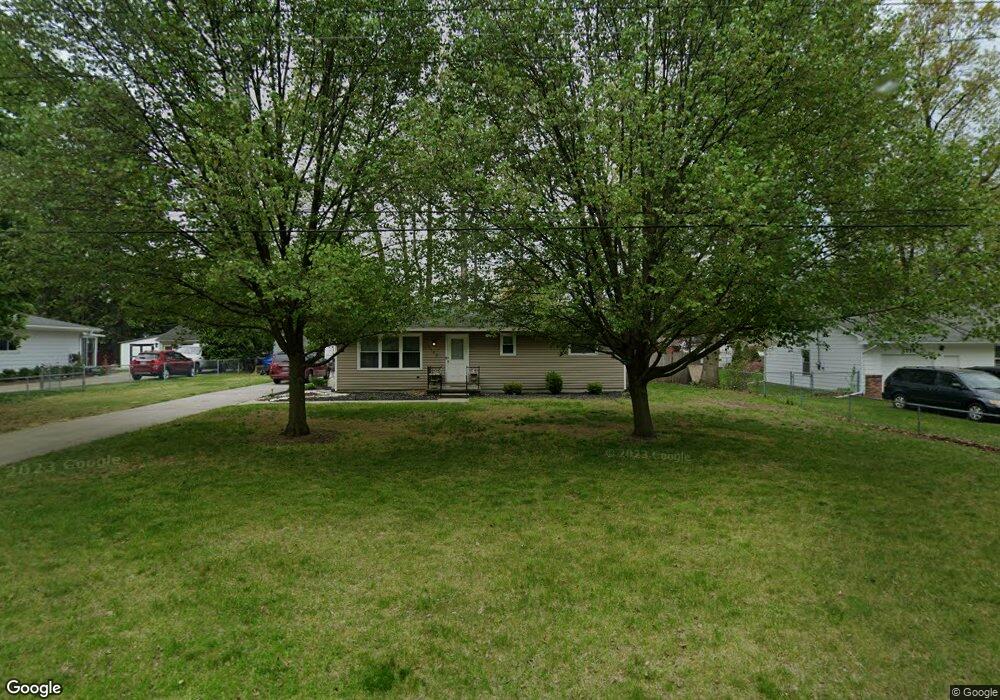
1105 Hackman Dr Temperance, MI 48182
Estimated Value: $155,000 - $247,000
2
Beds
1
Bath
984
Sq Ft
$197/Sq Ft
Est. Value
About This Home
This home is located at 1105 Hackman Dr, Temperance, MI 48182 and is currently estimated at $194,158, approximately $197 per square foot. 1105 Hackman Dr is a home located in Monroe County with nearby schools including Jackman Road Elementary School, Bedford Junior High School, and Bedford High School.
Ownership History
Date
Name
Owned For
Owner Type
Purchase Details
Closed on
Jul 11, 2016
Sold by
Meyers Melissa S
Bought by
Meyers Susan A
Current Estimated Value
Purchase Details
Closed on
Aug 6, 2011
Sold by
Federal Home Loan Mortgage Corporation
Bought by
Meyers Melissa A
Home Financials for this Owner
Home Financials are based on the most recent Mortgage that was taken out on this home.
Original Mortgage
$53,605
Interest Rate
4.75%
Mortgage Type
FHA
Purchase Details
Closed on
Jul 8, 2010
Sold by
Langton Michael
Bought by
Federal Home Loan Mortgage Corp
Purchase Details
Closed on
Apr 20, 2010
Sold by
Pirrone Gretchen
Bought by
Pirrone Jonathan M
Purchase Details
Closed on
Dec 1, 1998
Sold by
Trst Veronica Turski
Bought by
Mavis Timothy
Home Financials for this Owner
Home Financials are based on the most recent Mortgage that was taken out on this home.
Original Mortgage
$74,800
Interest Rate
6.75%
Mortgage Type
New Conventional
Create a Home Valuation Report for This Property
The Home Valuation Report is an in-depth analysis detailing your home's value as well as a comparison with similar homes in the area
Home Values in the Area
Average Home Value in this Area
Purchase History
| Date | Buyer | Sale Price | Title Company |
|---|---|---|---|
| Meyers Susan A | $80,000 | None Available | |
| Meyers Melissa A | $55,000 | -- | |
| Federal Home Loan Mortgage Corp | $102,755 | -- | |
| Pirrone Jonathan M | -- | -- | |
| Mavis Timothy | $93,500 | -- |
Source: Public Records
Mortgage History
| Date | Status | Borrower | Loan Amount |
|---|---|---|---|
| Previous Owner | Meyers Melissa A | $53,605 | |
| Previous Owner | Mavis Timothy | $74,800 |
Source: Public Records
Tax History
| Year | Tax Paid | Tax Assessment Tax Assessment Total Assessment is a certain percentage of the fair market value that is determined by local assessors to be the total taxable value of land and additions on the property. | Land | Improvement |
|---|---|---|---|---|
| 2025 | $640 | $79,200 | $79,200 | $0 |
| 2024 | $621 | $76,300 | $0 | $0 |
| 2023 | $591 | $67,200 | $0 | $0 |
| 2022 | $1,821 | $67,200 | $0 | $0 |
| 2021 | $1,800 | $66,300 | $0 | $0 |
| 2020 | $1,291 | $54,700 | $0 | $0 |
| 2019 | $1,743 | $54,700 | $0 | $0 |
| 2018 | $1,639 | $56,800 | $0 | $0 |
| 2017 | $1,492 | $56,800 | $0 | $0 |
| 2016 | $1,447 | $55,300 | $0 | $0 |
| 2015 | $1,028 | $50,400 | $0 | $0 |
| 2014 | $1,028 | $50,400 | $0 | $0 |
| 2013 | $1,263 | $47,600 | $0 | $0 |
Source: Public Records
Map
Nearby Homes
- 0 Jackman Lots 1 and 2 Rd Unit 50201182
- 855 Mildred Ave
- 601 W Dean Rd
- 1456 Meadowbrook Way
- 7808 Lewis Ave
- 8811 Tamarack Dr
- 945 Santa fe Ct
- 1440 Tennyson Dr
- 1103 W Temperance Rd
- 518 Kilbury
- 1593 Longfellow Dr
- 1027 S Park Dr
- 1142 S Park Dr
- 109 W Dean Rd
- 1747 Center Dr
- 7497 Savanna Dr
- 9135 Village Meadows Dr
- 1944 Stoneybrook Ln
- 8951 Jackman Rd
- 519 W Sterns Rd
- 1091 Hackman Dr
- 1119 Hackman Dr
- 1086 Feltis Dr
- 1102 Feltis Dr
- 1077 Hackman Dr
- 1133 Hackman Dr
- 1070 Feltis Dr
- 1070 Feltis Dr
- 1114 Feltis Dr
- 1120 Hackman Dr
- 1124 Hackman Dr
- 1106 Hackman Dr
- 1064 Feltis Dr
- 1082 Hackman Dr
- 1147 Hackman Dr
- 1078 Hackman Dr
- 1134 Hackman Dr
- 1059 Hackman Dr
- 1144 Feltis Dr
- 1064 Hackman Dr
Your Personal Tour Guide
Ask me questions while you tour the home.