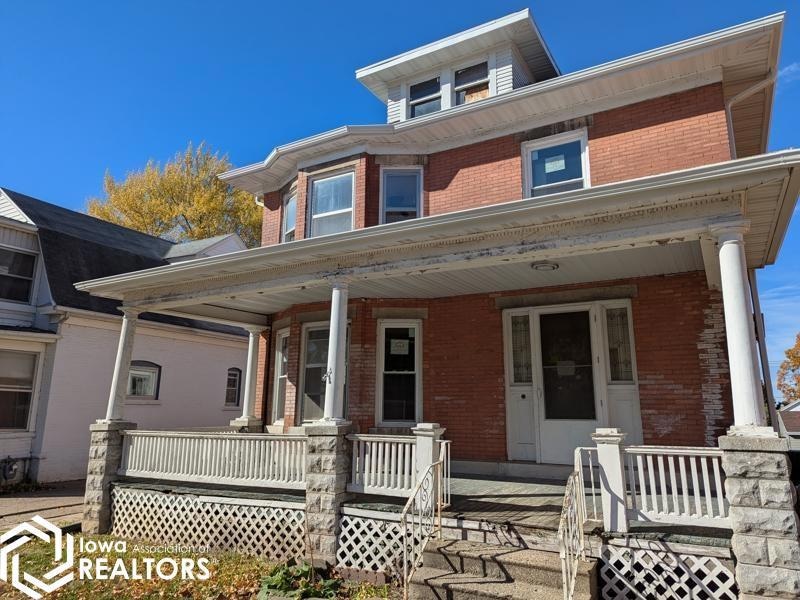
1105 N 8th St Burlington, IA 52601
Estimated payment $783/month
About This Home
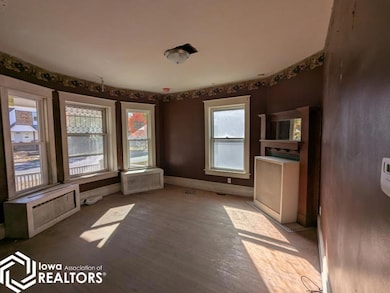
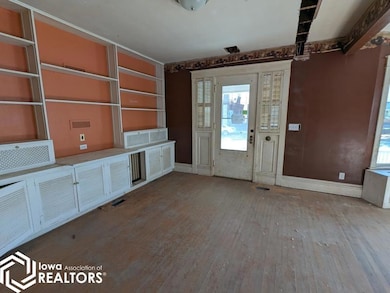
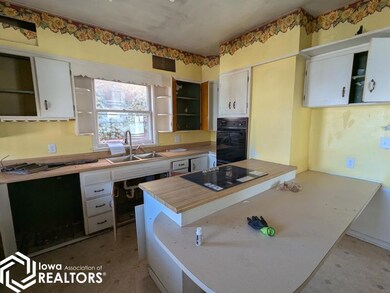
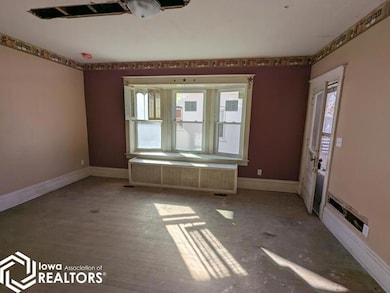
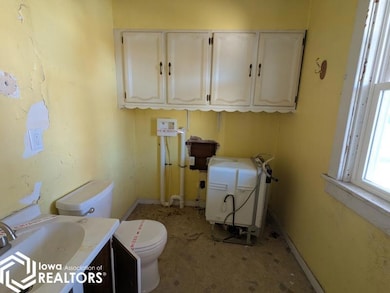
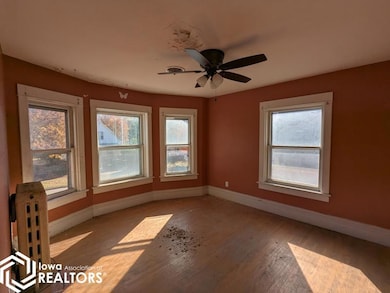
Brick home with 4 bedrooms, 1.5 baths (one on each floor), formal dining room, main floor bath and a detached garage. This home is being listed with repairs. This property is eligible under the Freddie Mac First Look Initiative through 12/12/2025.
Home Details
Home Type
- Single Family
Est. Annual Taxes
- $2,760
Year Built
- Built in 1900
Parking
- 1
Home Design
- Brick Exterior Construction
Kitchen
- Built-In Oven
- Cooktop
Additional Features
- Fireplace
- Lot Dimensions are 57x117
- Forced Air Heating System
- Unfinished Basement
Map
Home Values in the Area
Average Home Value in this Area
Tax History
| Year | Tax Paid | Tax Assessment Tax Assessment Total Assessment is a certain percentage of the fair market value that is determined by local assessors to be the total taxable value of land and additions on the property. | Land | Improvement |
|---|---|---|---|---|
| 2025 | $2,760 | $98,100 | $12,600 | $85,500 |
| 2024 | $2,760 | $86,500 | $12,600 | $73,900 |
| 2023 | $2,403 | $86,500 | $12,600 | $73,900 |
| 2022 | $1,392 | $68,400 | $12,600 | $55,800 |
| 2021 | $2,387 | $68,400 | $12,600 | $55,800 |
| 2020 | $3,014 | $68,400 | $12,600 | $55,800 |
| 2019 | $3,310 | $68,400 | $12,600 | $55,800 |
| 2018 | $2,464 | $84,300 | $10,500 | $73,800 |
| 2017 | $1,898 | $80,600 | $0 | $0 |
| 2016 | $1,836 | $80,600 | $0 | $0 |
| 2015 | $1,836 | $80,600 | $0 | $0 |
| 2014 | $1,858 | $78,200 | $0 | $0 |
Property History
| Date | Event | Price | List to Sale | Price per Sq Ft | Prior Sale |
|---|---|---|---|---|---|
| 11/11/2025 11/11/25 | For Sale | $104,900 | +31.3% | $49 / Sq Ft | |
| 03/05/2013 03/05/13 | Sold | $79,900 | -15.8% | -- | View Prior Sale |
| 02/08/2013 02/08/13 | Pending | -- | -- | -- | |
| 07/24/2012 07/24/12 | For Sale | $94,900 | -- | -- |
Purchase History
| Date | Type | Sale Price | Title Company |
|---|---|---|---|
| Special Warranty Deed | -- | None Listed On Document | |
| Sheriffs Deed | $25,140 | None Listed On Document | |
| Quit Claim Deed | -- | None Available | |
| Warranty Deed | $91,000 | None Available |
Mortgage History
| Date | Status | Loan Amount | Loan Type |
|---|---|---|---|
| Previous Owner | $91,000 | New Conventional |
Source: NoCoast MLS
MLS Number: NOC6333660
APN: 11-32-282-006
Disclaimer: Certain information contained herein is derived from information provided by parties other than Homes.com. All information provided is deemed reliable, but is not guaranteed to be accurate and should be independently verified.
![]() IDX information is provided exclusively for personal, non-commercial use, and may not be used for any purpose other than to identify prospective properties consumers may be interested in purchasing.
IDX information is provided exclusively for personal, non-commercial use, and may not be used for any purpose other than to identify prospective properties consumers may be interested in purchasing.
Information is deemed reliable but not guaranteed.
- 1841 1/2 Highland Ave Unit 1841 Highland
- 1406 Corse St
- 424 N 3rd St
- 100-122 N 4th St
- 531 S Central Ave Unit 525
- 603 Summer St
- 1404 Grove St
- 1609 Pine St
- 3100 Market St
- 301 Bel Aire Ct
- 2213 N Roosevelt Ave
- 701 E Pennington St
- 10994 115th Ave
- 4051 West Ave
- 2917 Madison Ave
- 517 Vernon St
- 1204 Koestner St Unit 2
- 813 W van Weiss Blvd
- 514 Layne Dr Unit 1
- 510 Layne Dr
