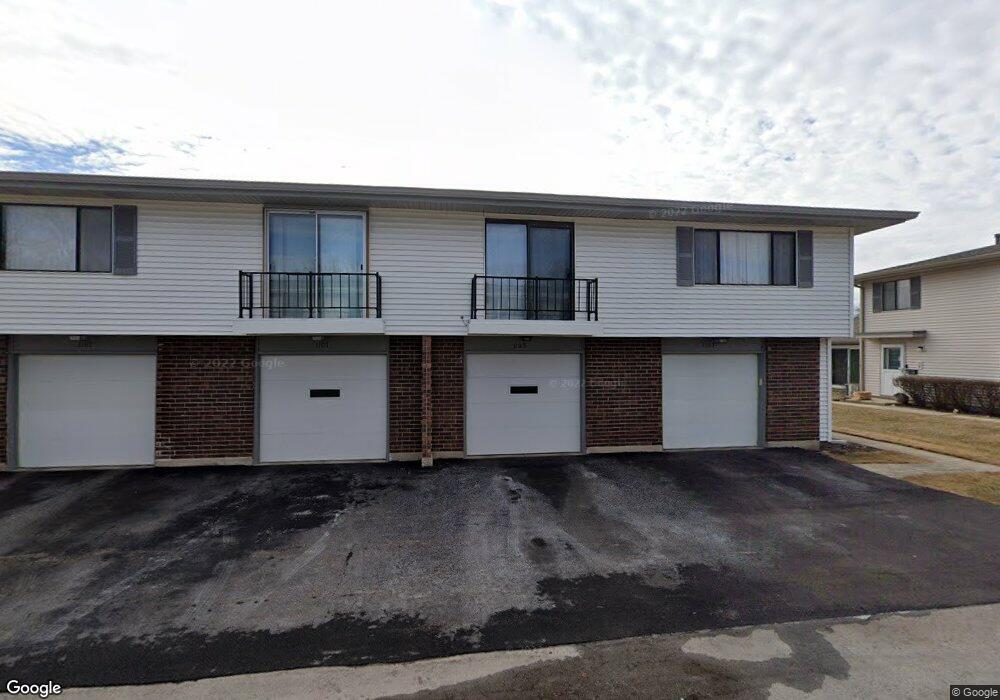
1105 Quanset Ct Unit 1722 Schaumburg, IL 60194
Hoover Park NeighborhoodEstimated Value: $231,768 - $255,000
3
Beds
--
Bath
--
Sq Ft
35.48
Acres
About This Home
This home is located at 1105 Quanset Ct Unit 1722, Schaumburg, IL 60194 and is currently estimated at $243,442. 1105 Quanset Ct Unit 1722 is a home located in Cook County with nearby schools including Enders-Salk Elementary School, Helen Keller Junior High School, and Schaumburg High School.
Ownership History
Date
Name
Owned For
Owner Type
Purchase Details
Closed on
Jul 13, 2018
Sold by
Pavone Antonio
Bought by
Pavone Family Joint Revocable Trust
Current Estimated Value
Purchase Details
Closed on
May 27, 2005
Sold by
Sandalow Janice A
Bought by
Pavone Antonio
Home Financials for this Owner
Home Financials are based on the most recent Mortgage that was taken out on this home.
Original Mortgage
$134,400
Interest Rate
5.91%
Mortgage Type
Fannie Mae Freddie Mac
Purchase Details
Closed on
Jul 9, 2001
Sold by
Bell Diane
Bought by
Sandalow Janice A
Home Financials for this Owner
Home Financials are based on the most recent Mortgage that was taken out on this home.
Original Mortgage
$103,000
Interest Rate
7.23%
Create a Home Valuation Report for This Property
The Home Valuation Report is an in-depth analysis detailing your home's value as well as a comparison with similar homes in the area
Home Values in the Area
Average Home Value in this Area
Purchase History
| Date | Buyer | Sale Price | Title Company |
|---|---|---|---|
| Pavone Family Joint Revocable Trust | -- | Attorney | |
| Pavone Antonio | $168,000 | Multiple | |
| Sandalow Janice A | $118,000 | -- |
Source: Public Records
Mortgage History
| Date | Status | Borrower | Loan Amount |
|---|---|---|---|
| Previous Owner | Pavone Antonio | $134,400 | |
| Previous Owner | Sandalow Janice A | $103,000 |
Source: Public Records
Tax History Compared to Growth
Tax History
| Year | Tax Paid | Tax Assessment Tax Assessment Total Assessment is a certain percentage of the fair market value that is determined by local assessors to be the total taxable value of land and additions on the property. | Land | Improvement |
|---|---|---|---|---|
| 2024 | $3,473 | $15,716 | $4,946 | $10,770 |
| 2023 | $3,340 | $15,716 | $4,946 | $10,770 |
| 2022 | $3,340 | $15,716 | $4,946 | $10,770 |
| 2021 | $2,676 | $12,159 | $6,336 | $5,823 |
| 2020 | $2,698 | $12,159 | $6,336 | $5,823 |
| 2019 | $2,704 | $13,517 | $6,336 | $7,181 |
| 2018 | $1,500 | $8,432 | $5,332 | $3,100 |
| 2017 | $1,494 | $8,432 | $5,332 | $3,100 |
| 2016 | $1,639 | $8,432 | $5,332 | $3,100 |
| 2015 | $1,349 | $7,134 | $4,636 | $2,498 |
| 2014 | $1,351 | $7,134 | $4,636 | $2,498 |
| 2013 | $1,299 | $7,134 | $4,636 | $2,498 |
Source: Public Records
Map
Nearby Homes
- 1123 Stoughton Ct Unit 1664
- 421 N Braintree Dr
- 501 Argyll Ln
- 225 Barcliffe Ln Unit 1011
- 1314 Colwyn Dr
- 104 N Braintree Dr
- 1425 Colwyn Dr
- 100 Ellington Dr
- 1125 Charlene Ln
- 365 Washington Blvd
- 640 Downey St
- 1321 Yarmouth Ct Unit 662
- 320 Pleasant St
- 645 Maywood Ln
- 585 Newark Ln
- 908 Jeffery Ct
- 700 N Hundley St
- 220 Kemah Ln
- 12 Stone Bridge Ct
- 510 Milan Ln
- 1101 Quanset Ct Unit 1723
- 1101 Quanset Ct Unit 1101
- 1103 Quanset Ct Unit 1721
- 1107 Quanset Ct Unit 1724
- 1115 Quanset Ct Unit 1734
- 1104 Quanset Ct Unit 1794
- 1109 Quanset Ct Unit 1733
- 1104 Stoughton Ct Unit 1714
- 1113 Quanset Ct Unit 1732
- 1100 Stoughton Ct Unit 1711
- 1102 Stoughton Ct Unit 1713
- 1106 Stoughton Ct Unit 1712
- 1039 Quanset Ct Unit 1851
- 1114 Quanset Ct Unit 1782
- 1043 Quanset Ct Unit 1854
- 1102 Quanset Ct Unit 1793
- 1100 Quanset Ct Unit 1791
- 1041 Quanset Ct Unit 1852
- 1112 Stoughton Ct Unit 1704
- 1108 Stoughton Ct Unit 1701