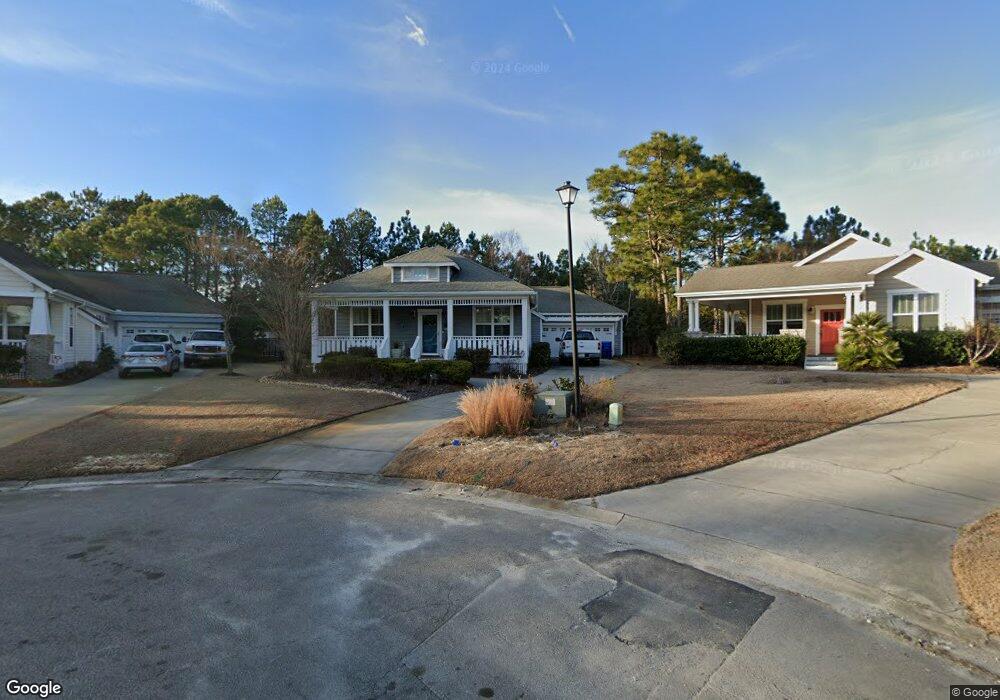
1105 Reed Ct Surf City, NC 28445
Estimated Value: $377,181 - $498,000
3
Beds
2
Baths
1,728
Sq Ft
$245/Sq Ft
Est. Value
About This Home
This home is located at 1105 Reed Ct, Surf City, NC 28445 and is currently estimated at $422,795, approximately $244 per square foot. 1105 Reed Ct is a home located in Onslow County with nearby schools including Coastal Elementary, Dixon Elementary School, and Dixon High School.
Ownership History
Date
Name
Owned For
Owner Type
Purchase Details
Closed on
Jun 22, 2009
Sold by
Scott Cook Construction Co Inc
Bought by
Harris Candy L and Gray Ann W
Current Estimated Value
Home Financials for this Owner
Home Financials are based on the most recent Mortgage that was taken out on this home.
Original Mortgage
$208,000
Outstanding Balance
$132,195
Interest Rate
4.88%
Mortgage Type
Purchase Money Mortgage
Estimated Equity
$290,600
Purchase Details
Closed on
Dec 4, 2008
Sold by
Neighborhoods Of Holly Ridge Llc
Bought by
Scott Cook Construction Co
Home Financials for this Owner
Home Financials are based on the most recent Mortgage that was taken out on this home.
Original Mortgage
$192,000
Interest Rate
6.01%
Mortgage Type
Future Advance Clause Open End Mortgage
Create a Home Valuation Report for This Property
The Home Valuation Report is an in-depth analysis detailing your home's value as well as a comparison with similar homes in the area
Home Values in the Area
Average Home Value in this Area
Purchase History
| Date | Buyer | Sale Price | Title Company |
|---|---|---|---|
| Harris Candy L | $261,000 | None Available | |
| Scott Cook Construction Co | $45,000 | None Available |
Source: Public Records
Mortgage History
| Date | Status | Borrower | Loan Amount |
|---|---|---|---|
| Open | Harris Candy L | $208,000 | |
| Previous Owner | Scott Cook Construction Co | $192,000 |
Source: Public Records
Tax History Compared to Growth
Tax History
| Year | Tax Paid | Tax Assessment Tax Assessment Total Assessment is a certain percentage of the fair market value that is determined by local assessors to be the total taxable value of land and additions on the property. | Land | Improvement |
|---|---|---|---|---|
| 2025 | $3,078 | $309,364 | $45,000 | $264,364 |
| 2024 | $3,078 | $309,364 | $45,000 | $264,364 |
| 2023 | $3,078 | $309,364 | $45,000 | $264,364 |
| 2022 | $3,109 | $309,364 | $45,000 | $264,364 |
| 2021 | $2,628 | $240,040 | $40,000 | $200,040 |
| 2020 | $2,628 | $240,040 | $40,000 | $200,040 |
| 2019 | $2,640 | $240,040 | $40,000 | $200,040 |
| 2018 | $2,664 | $240,040 | $40,000 | $200,040 |
| 2017 | $2,736 | $250,990 | $50,000 | $200,990 |
| 2016 | $2,736 | $250,990 | $0 | $0 |
| 2015 | $2,736 | $250,990 | $0 | $0 |
| 2014 | $2,736 | $250,990 | $0 | $0 |
Source: Public Records
Map
Nearby Homes
- 1213 Daisy Ct
- 807 Wildflower Dr
- 437 Belvedere Dr
- 301 Log Cabin Way
- 333 Rose Bud Ln
- 202 Bungalow Rd
- 435 Belvedere Dr
- 229 Red Carnation Dr
- 359 Belvedere Dr
- 110 Hampton Dr
- 204 Red Carnation Dr
- 8 Hwy 50
- 767 E Ocean Rd
- 206 Holden Rd
- 134 Merry Ln
- 17 Off
- 77 Sandy Ln
- 1001 Mabel Rawlinson Dr
- 156 Poplar Branch Way
- 129 Poplar Branch Way