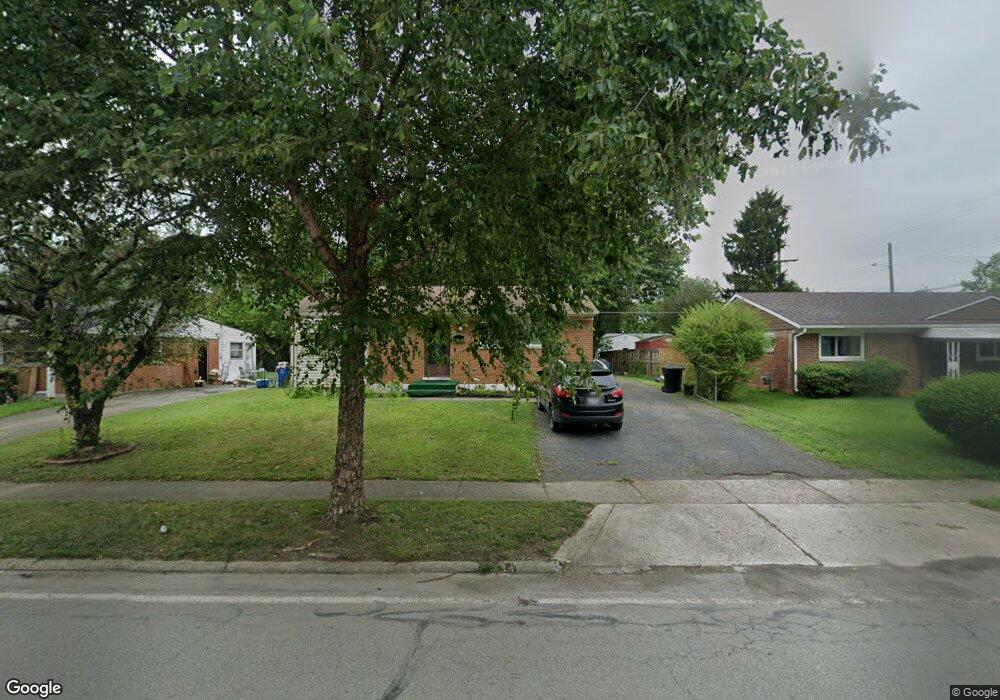
1105 S Yearling Rd Columbus, OH 43227
Beechwood NeighborhoodEstimated Value: $191,000 - $255,000
3
Beds
2
Baths
961
Sq Ft
$225/Sq Ft
Est. Value
About This Home
This home is located at 1105 S Yearling Rd, Columbus, OH 43227 and is currently estimated at $216,197, approximately $224 per square foot. 1105 S Yearling Rd is a home located in Franklin County with nearby schools including Shady Lane Elementary School, Sherwood Middle School, and Walnut Ridge High School.
Ownership History
Date
Name
Owned For
Owner Type
Purchase Details
Closed on
Sep 30, 2019
Sold by
Roebuck John V
Bought by
Hansbrew Tara
Current Estimated Value
Home Financials for this Owner
Home Financials are based on the most recent Mortgage that was taken out on this home.
Original Mortgage
$112,818
Outstanding Balance
$98,051
Interest Rate
3.12%
Mortgage Type
FHA
Estimated Equity
$118,146
Purchase Details
Closed on
Jan 6, 1995
Sold by
Skunza Adrian M
Bought by
Roebuck John V and Roebuck Catherine E
Home Financials for this Owner
Home Financials are based on the most recent Mortgage that was taken out on this home.
Original Mortgage
$63,750
Interest Rate
9.5%
Mortgage Type
VA
Purchase Details
Closed on
Jun 25, 1991
Purchase Details
Closed on
Nov 1, 1989
Create a Home Valuation Report for This Property
The Home Valuation Report is an in-depth analysis detailing your home's value as well as a comparison with similar homes in the area
Home Values in the Area
Average Home Value in this Area
Purchase History
| Date | Buyer | Sale Price | Title Company |
|---|---|---|---|
| Hansbrew Tara | $114,900 | Valmer Land Title Agency Box | |
| Roebuck John V | $62,500 | -- | |
| -- | -- | -- | |
| -- | $53,900 | -- |
Source: Public Records
Mortgage History
| Date | Status | Borrower | Loan Amount |
|---|---|---|---|
| Open | Hansbrew Tara | $112,818 | |
| Previous Owner | Roebuck John V | $63,750 |
Source: Public Records
Tax History Compared to Growth
Tax History
| Year | Tax Paid | Tax Assessment Tax Assessment Total Assessment is a certain percentage of the fair market value that is determined by local assessors to be the total taxable value of land and additions on the property. | Land | Improvement |
|---|---|---|---|---|
| 2024 | $2,730 | $60,830 | $14,700 | $46,130 |
| 2023 | $2,695 | $60,830 | $14,700 | $46,130 |
| 2022 | $1,921 | $37,030 | $6,300 | $30,730 |
| 2021 | $1,924 | $37,030 | $6,300 | $30,730 |
| 2020 | $1,926 | $37,030 | $6,300 | $30,730 |
| 2019 | $1,428 | $22,960 | $5,040 | $17,920 |
| 2018 | $1,291 | $22,960 | $5,040 | $17,920 |
| 2017 | $1,349 | $22,960 | $5,040 | $17,920 |
| 2016 | $1,270 | $18,700 | $4,940 | $13,760 |
| 2015 | $1,157 | $18,700 | $4,940 | $13,760 |
| 2014 | $1,159 | $18,700 | $4,940 | $13,760 |
| 2013 | $672 | $21,980 | $5,810 | $16,170 |
Source: Public Records
Map
Nearby Homes
- 1220 Elderwood Ave
- 1291 Westphal Ave
- 3955 E Fulton St
- 963 Erickson Ave
- 3945 Dillon Dr
- 4144 Mcallister Ave
- 4363 E Mound St
- 4181 Colby Ave
- 4094 E Main St
- 1294 Dellwood Ave
- 1068 Ross Rd
- 4295 Colby Ave
- 798 S Yearling Rd
- 931 E Fulton St
- 1490 Elaine Rd Unit 1462
- 1085 S Hamilton Rd
- 1281 Maetzel Dr
- 4467 Grimsby Rd
- 4501 Amesbury Rd
- 4484 Grimsby Rd
- 1113 S Yearling Rd
- 1097 S Yearling Rd
- 1100 Striebel Rd
- 1121 S Yearling Rd
- 1092 Striebel Rd
- 4121 E Mound St
- 1089 S Yearling Rd
- 1116 Striebel Rd
- 4113 E Mound St
- 1108 S Yearling Rd
- 1129 S Yearling Rd
- 1100 S Yearling Rd
- 1080 Striebel Rd
- 1092 S Yearling Rd
- 1124 S Yearling Rd
- 1124 Striebel Rd
- 1132 S Yearling Rd
- 4153 E Mound St
- 1132 Striebel Rd
- 4080 E Fulton St