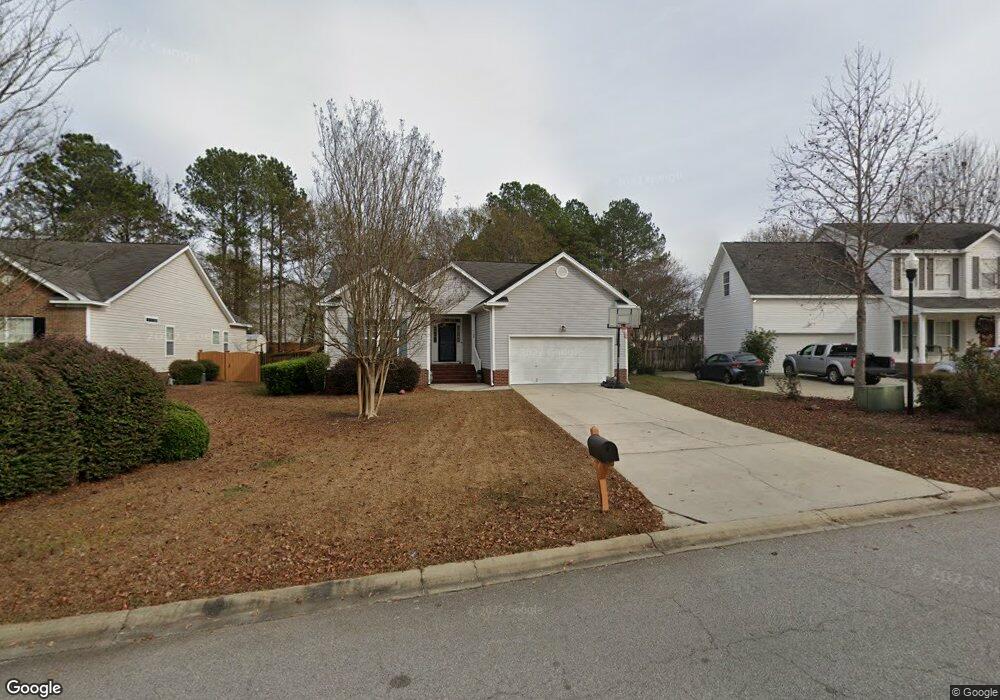
1105 Saluda Chase Way West Columbia, SC 29169
Estimated Value: $306,000 - $344,000
3
Beds
3
Baths
1,867
Sq Ft
$173/Sq Ft
Est. Value
About This Home
This home is located at 1105 Saluda Chase Way, West Columbia, SC 29169 and is currently estimated at $323,720, approximately $173 per square foot. 1105 Saluda Chase Way is a home located in Lexington County with nearby schools including Saluda River Academy For The Arts, Northside Middle, and Brookland-Cayce High School.
Ownership History
Date
Name
Owned For
Owner Type
Purchase Details
Closed on
Jun 15, 2021
Sold by
Parmar Krunal N and Parmar Jignashaben R
Bought by
Chauhan Indumatibahen R and Chauhan Rajendrasinh N
Current Estimated Value
Home Financials for this Owner
Home Financials are based on the most recent Mortgage that was taken out on this home.
Original Mortgage
$212,500
Outstanding Balance
$192,392
Interest Rate
2.9%
Mortgage Type
New Conventional
Estimated Equity
$131,328
Purchase Details
Closed on
Apr 2, 2007
Sold by
Piercy Anne B
Bought by
Parmar Krunal N and Parmar Jignashaben R
Home Financials for this Owner
Home Financials are based on the most recent Mortgage that was taken out on this home.
Original Mortgage
$179,500
Interest Rate
6.27%
Mortgage Type
Purchase Money Mortgage
Create a Home Valuation Report for This Property
The Home Valuation Report is an in-depth analysis detailing your home's value as well as a comparison with similar homes in the area
Home Values in the Area
Average Home Value in this Area
Purchase History
| Date | Buyer | Sale Price | Title Company |
|---|---|---|---|
| Chauhan Indumatibahen R | $250,000 | None Available | |
| Parmar Krunal N | $188,999 | None Available |
Source: Public Records
Mortgage History
| Date | Status | Borrower | Loan Amount |
|---|---|---|---|
| Open | Chauhan Indumatibahen R | $212,500 | |
| Previous Owner | Parmar Krunal N | $179,500 |
Source: Public Records
Tax History Compared to Growth
Tax History
| Year | Tax Paid | Tax Assessment Tax Assessment Total Assessment is a certain percentage of the fair market value that is determined by local assessors to be the total taxable value of land and additions on the property. | Land | Improvement |
|---|---|---|---|---|
| 2024 | $2,119 | $10,000 | $1,600 | $8,400 |
| 2023 | $1,911 | $10,000 | $1,600 | $8,400 |
| 2022 | $1,930 | $10,000 | $1,600 | $8,400 |
| 2020 | $1,364 | $7,359 | $1,600 | $5,759 |
| 2019 | $1,339 | $7,078 | $1,400 | $5,678 |
| 2018 | $1,353 | $7,078 | $1,400 | $5,678 |
| 2017 | $1,298 | $7,078 | $1,400 | $5,678 |
| 2016 | $1,335 | $7,077 | $1,400 | $5,677 |
| 2014 | $1,084 | $7,559 | $1,200 | $6,359 |
| 2013 | -- | $7,560 | $1,200 | $6,360 |
Source: Public Records
Map
Nearby Homes
- 1509 Goldfinch Ln
- 1500 Redwood Dr
- 292 Marabou Cir
- 1711 Holly Hill Dr
- 1540 Sewanee Dr
- 0 Terrace View Dr
- 0 Sunset Blvd Unit 553428
- 108 Double Branch Ct
- 100 Double Branch Ct
- 318 Skipperling Ln
- 1715 Gilvie Ave
- 175 Hulon Greene Place Unit 3
- 55 Holly Ridge Ln
- 7 Janice Fe Trail
- 500 Finnegan Ln
- 13 Janice Fe Trail
- 21 Janice Fe Trail
- 0 Quail Hollow Ln
- 529 Finnegan Ln
- 106 Meadowview Ct
- 1101 Saluda Chase Way
- 1109 Saluda Chase Way
- 1012 Riverstone Ct
- 1016 Riverstone Ct
- 1001 Crestwater Ct
- 1104 Saluda Chase Way
- 1009 Crestwater Ct
- 1100 Saluda Chase Way
- 1013 Crestwater Ct
- 1005 Riverstone Ct
- 1001 Riverstone Ct
- 1009 Riverstone Ct
- 1112 Saluda Chase Way
- 1012 Saluda Chase Way
- 1020 Riverstone Ct
- 1017 Crestwater Ct
- 1013 Riverstone Ct
- 1008 Saluda Chase Way
- 1116 Saluda Chase Way
- 1021 Crestwater Ct