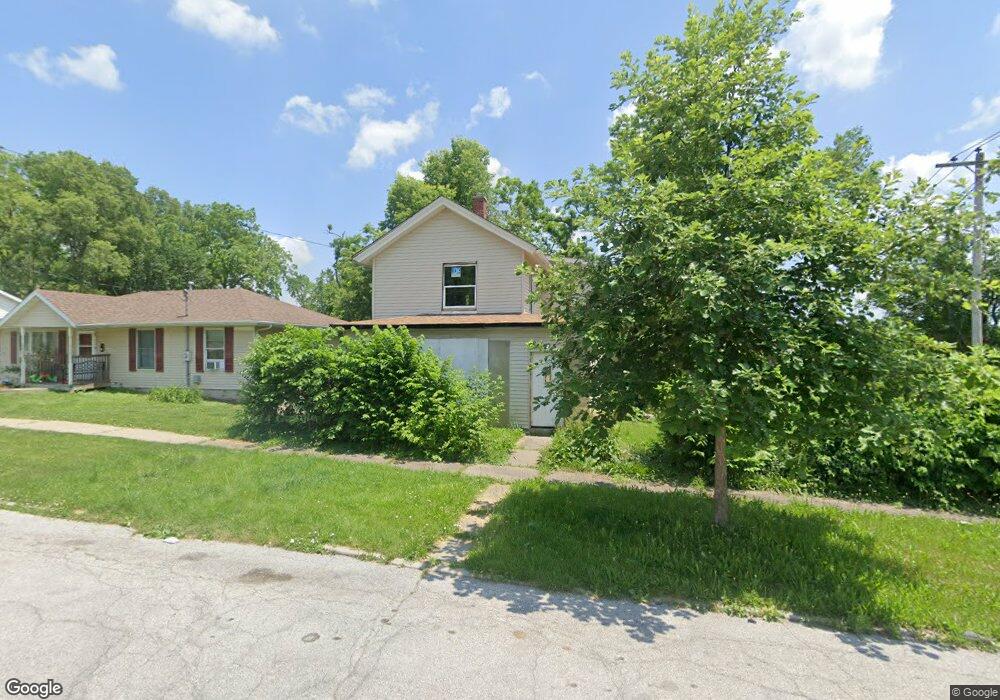
1105 Scott St Davenport, IA 52803
Central Davenport NeighborhoodEstimated Value: $63,000 - $139,000
3
Beds
2
Baths
1,060
Sq Ft
$83/Sq Ft
Est. Value
About This Home
This home is located at 1105 Scott St, Davenport, IA 52803 and is currently estimated at $88,025, approximately $83 per square foot. 1105 Scott St is a home located in Scott County with nearby schools including Walnut Hill Elementary School, Crofton Elementary School, and Casey County Middle School.
Ownership History
Date
Name
Owned For
Owner Type
Purchase Details
Closed on
Aug 6, 2020
Sold by
Jack Bear Properties Llc
Bought by
Jackson Devin and Jackson Jchemela
Current Estimated Value
Purchase Details
Closed on
Jun 28, 2016
Sold by
Vanzuiden Daron D and Van Zuiden Deborah L
Bought by
Jack Bear Properties Llc
Purchase Details
Closed on
Jul 26, 2006
Sold by
Roberts Jason B and Roberts Yolanda J
Bought by
Vanzuiden Daron D
Create a Home Valuation Report for This Property
The Home Valuation Report is an in-depth analysis detailing your home's value as well as a comparison with similar homes in the area
Home Values in the Area
Average Home Value in this Area
Purchase History
| Date | Buyer | Sale Price | Title Company |
|---|---|---|---|
| Jackson Devin | $22,000 | None Available | |
| Jack Bear Properties Llc | $8,000 | None Available | |
| Vanzuiden Daron D | $32,500 | None Available |
Source: Public Records
Mortgage History
| Date | Status | Borrower | Loan Amount |
|---|---|---|---|
| Closed | Vanzuiden Daron D | $0 |
Source: Public Records
Tax History Compared to Growth
Tax History
| Year | Tax Paid | Tax Assessment Tax Assessment Total Assessment is a certain percentage of the fair market value that is determined by local assessors to be the total taxable value of land and additions on the property. | Land | Improvement |
|---|---|---|---|---|
| 2025 | $660 | $37,720 | $17,550 | $20,170 |
| 2024 | $644 | $36,890 | $17,550 | $19,340 |
| 2023 | $904 | $36,890 | $17,550 | $19,340 |
| 2022 | $679 | $26,430 | $8,640 | $17,790 |
| 2021 | $554 | $25,820 | $8,640 | $17,180 |
| 2020 | $2,101 | $23,230 | $8,640 | $14,590 |
| 2019 | $717 | $23,260 | $8,640 | $14,620 |
| 2018 | $775 | $23,260 | $8,640 | $14,620 |
| 2017 | $129 | $23,260 | $8,640 | $14,620 |
| 2016 | $2,009 | $37,890 | $0 | $0 |
| 2015 | $861 | $39,300 | $0 | $0 |
| 2014 | $872 | $39,300 | $0 | $0 |
| 2013 | $858 | $0 | $0 | $0 |
| 2012 | -- | $39,240 | $9,640 | $29,600 |
Source: Public Records
Map
Nearby Homes