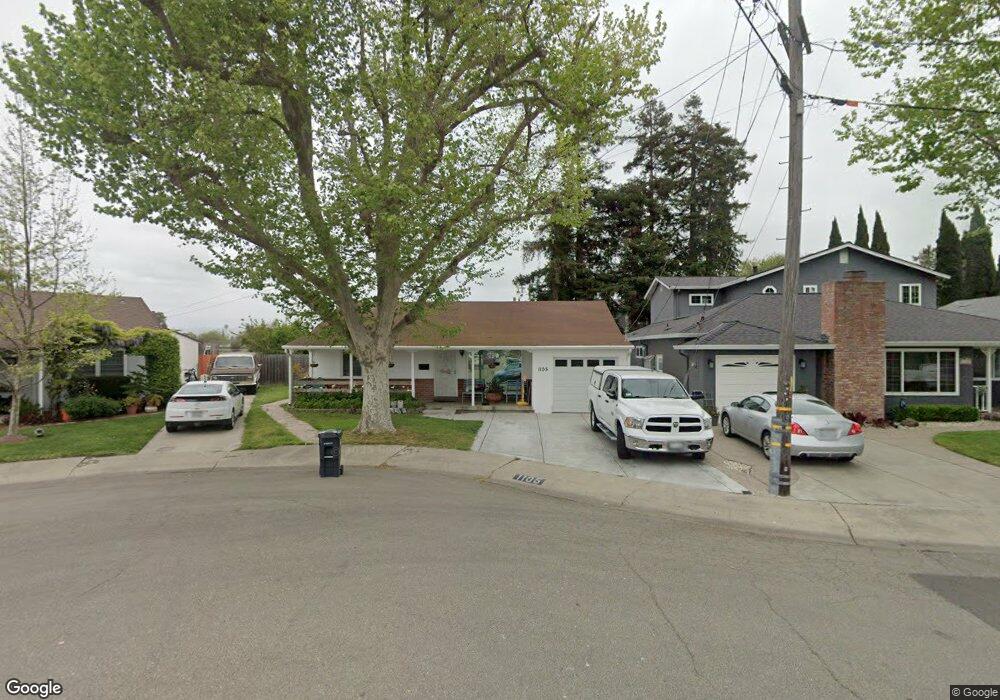
1105 Via Esperanza San Lorenzo, CA 94580
Estimated Value: $773,000 - $804,000
3
Beds
1
Bath
1,043
Sq Ft
$753/Sq Ft
Est. Value
About This Home
This home is located at 1105 Via Esperanza, San Lorenzo, CA 94580 and is currently estimated at $785,110, approximately $752 per square foot. 1105 Via Esperanza is a home located in Alameda County with nearby schools including Del Rey Elementary School, Bohannon Middle School, and Arroyo High School.
Ownership History
Date
Name
Owned For
Owner Type
Purchase Details
Closed on
Jan 9, 2012
Sold by
White Linda M and Throolin Trust
Bought by
Torres Miriam Mirleth
Current Estimated Value
Home Financials for this Owner
Home Financials are based on the most recent Mortgage that was taken out on this home.
Original Mortgage
$252,434
Outstanding Balance
$176,498
Interest Rate
4.4%
Mortgage Type
FHA
Estimated Equity
$608,612
Purchase Details
Closed on
Oct 17, 2011
Sold by
White L Merline and The L Merline White Trust
Bought by
White Linda M and Throolin Trust
Purchase Details
Closed on
Sep 13, 2010
Sold by
White Linda Merline
Bought by
White L Merline and The L Merline White Trust
Purchase Details
Closed on
Feb 16, 2010
Sold by
White Linda Merline and Throolin Trust
Bought by
White Linda Merline
Create a Home Valuation Report for This Property
The Home Valuation Report is an in-depth analysis detailing your home's value as well as a comparison with similar homes in the area
Home Values in the Area
Average Home Value in this Area
Purchase History
| Date | Buyer | Sale Price | Title Company |
|---|---|---|---|
| Torres Miriam Mirleth | $259,000 | Old Republic Title Company | |
| White Linda M | $250,000 | None Available | |
| White L Merline | -- | None Available | |
| White Linda Merline | -- | None Available |
Source: Public Records
Mortgage History
| Date | Status | Borrower | Loan Amount |
|---|---|---|---|
| Open | Torres Miriam Mirleth | $252,434 |
Source: Public Records
Tax History Compared to Growth
Tax History
| Year | Tax Paid | Tax Assessment Tax Assessment Total Assessment is a certain percentage of the fair market value that is determined by local assessors to be the total taxable value of land and additions on the property. | Land | Improvement |
|---|---|---|---|---|
| 2025 | $4,500 | $318,300 | $97,590 | $227,710 |
| 2024 | $4,500 | $311,924 | $95,677 | $223,247 |
| 2023 | $4,487 | $312,671 | $93,801 | $218,870 |
| 2022 | $4,411 | $299,541 | $91,962 | $214,579 |
| 2021 | $4,284 | $293,532 | $90,159 | $210,373 |
| 2020 | $4,184 | $297,453 | $89,236 | $208,217 |
| 2019 | $4,179 | $291,623 | $87,487 | $204,136 |
| 2018 | $3,916 | $285,907 | $85,772 | $200,135 |
| 2017 | $3,739 | $280,301 | $84,090 | $196,211 |
| 2016 | $3,564 | $274,806 | $82,442 | $192,364 |
| 2015 | $3,484 | $270,680 | $81,204 | $189,476 |
| 2014 | $3,432 | $265,378 | $79,613 | $185,765 |
Source: Public Records
Map
Nearby Homes
- 18005 Sunol Rd
- 18003 Incline Place
- 18018 Sahara Rd
- 18251 Via Jose
- 819 Bockman Rd
- 17354 Via el Cerrito
- 17316 Via Flores
- 17347 Via Encinas
- 17761 Via Arriba
- 19150 Hesperian Blvd Unit 19
- 769 Bartlett Ave
- 1311 Via Manzanas
- 1608 Keller Ave
- 16050 Via Olinda
- 1867 Via Buena Vista
- 19665 Royal Ave
- 19461 Royal Ave
- 1575 Via Lucas
- 825 W A St Unit 1
- 823 W A St Unit 2
- 1110 Via Los Trancos
- 1111 Via Esperanza
- 1118 Via Los Trancos
- 1117 Via Esperanza
- 17990 Azalea Rd
- 17992 Azalea Rd
- 17994 Azalea Rd
- 17996 Azalea Rd
- 1122 Via Los Trancos
- 1098 Azalea Ct
- 1115 Via Los Trancos
- 1096 Azalea Ct
- 1123 Via Esperanza
- 1038 Via Coralla
- 1094 Azalea Ct
- 1092 Azalea Ct
- 1046 Via Coralla
- 1086 Clubhouse Dr
- 1090 Azalea Ct
- 1119 Via Los Trancos