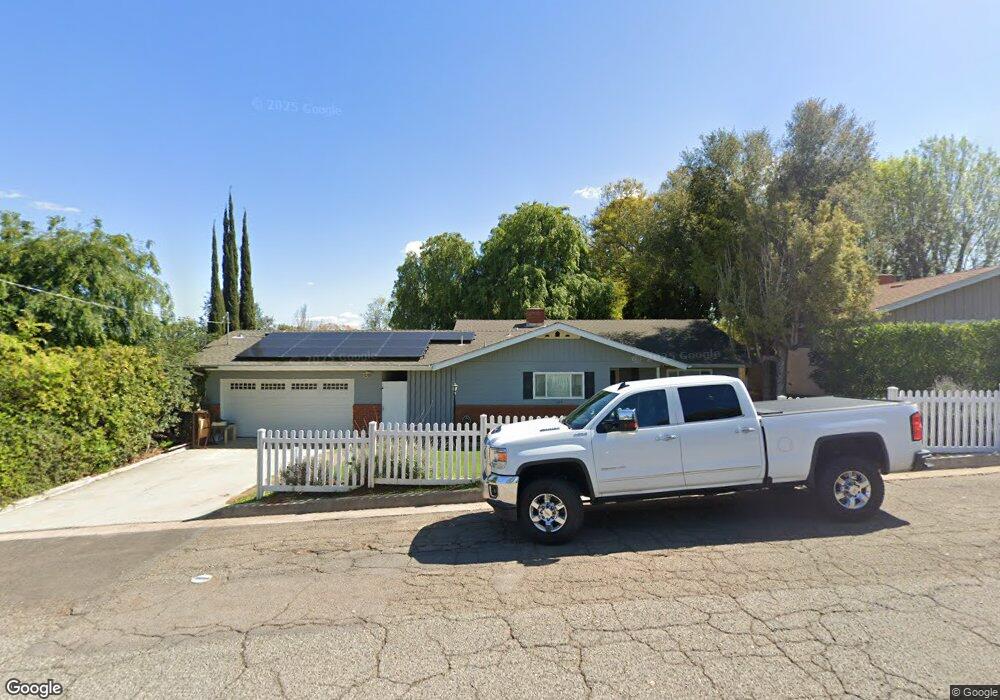
1105 W 11th Ave Escondido, CA 92025
Central Escondido NeighborhoodEstimated Value: $718,000 - $803,000
3
Beds
2
Baths
1,348
Sq Ft
$570/Sq Ft
Est. Value
About This Home
This home is located at 1105 W 11th Ave, Escondido, CA 92025 and is currently estimated at $767,801, approximately $569 per square foot. 1105 W 11th Ave is a home located in San Diego County with nearby schools including Felicita Elementary, Del Dios Academy of Arts & Sciences, and San Pasqual High School.
Ownership History
Date
Name
Owned For
Owner Type
Purchase Details
Closed on
Aug 18, 2012
Sold by
Federal Home Loan Mortgage Corporation
Bought by
Urton Tiffanie and Urton Matt
Current Estimated Value
Home Financials for this Owner
Home Financials are based on the most recent Mortgage that was taken out on this home.
Original Mortgage
$7,650
Outstanding Balance
$5,268
Interest Rate
3.47%
Mortgage Type
Second Mortgage Made To Cover Down Payment
Estimated Equity
$762,533
Purchase Details
Closed on
Dec 5, 2011
Sold by
Jones Steven C and Cronin Paula K
Bought by
Federal Home Loan Mortgage Corporation
Purchase Details
Closed on
Feb 26, 1999
Sold by
Jarvinen Lois
Bought by
Jones Steven C and Cronin Paula K
Home Financials for this Owner
Home Financials are based on the most recent Mortgage that was taken out on this home.
Original Mortgage
$147,495
Interest Rate
6.76%
Mortgage Type
VA
Create a Home Valuation Report for This Property
The Home Valuation Report is an in-depth analysis detailing your home's value as well as a comparison with similar homes in the area
Home Values in the Area
Average Home Value in this Area
Purchase History
| Date | Buyer | Sale Price | Title Company |
|---|---|---|---|
| Urton Tiffanie | $255,000 | California Title Company | |
| Federal Home Loan Mortgage Corporation | $224,391 | None Available | |
| Jones Steven C | $148,500 | Chicago Title Co |
Source: Public Records
Mortgage History
| Date | Status | Borrower | Loan Amount |
|---|---|---|---|
| Open | Urton Tiffanie | $7,650 | |
| Open | Urton Tiffanie | $250,381 | |
| Previous Owner | Jones Steven C | $147,495 |
Source: Public Records
Tax History Compared to Growth
Tax History
| Year | Tax Paid | Tax Assessment Tax Assessment Total Assessment is a certain percentage of the fair market value that is determined by local assessors to be the total taxable value of land and additions on the property. | Land | Improvement |
|---|---|---|---|---|
| 2025 | $3,462 | $314,002 | $106,388 | $207,614 |
| 2024 | $3,462 | $307,846 | $104,302 | $203,544 |
| 2023 | $3,382 | $301,810 | $102,257 | $199,553 |
| 2022 | $3,344 | $295,893 | $100,252 | $195,641 |
| 2021 | $3,289 | $290,092 | $98,287 | $191,805 |
| 2020 | $3,269 | $287,119 | $97,280 | $189,839 |
| 2019 | $3,189 | $281,490 | $95,373 | $186,117 |
| 2018 | $3,100 | $275,971 | $93,503 | $182,468 |
| 2017 | $40 | $270,561 | $91,670 | $178,891 |
| 2016 | $2,988 | $265,257 | $89,873 | $175,384 |
| 2015 | $2,962 | $261,274 | $88,524 | $172,750 |
| 2014 | $2,838 | $256,157 | $86,790 | $169,367 |
Source: Public Records
Map
Nearby Homes
- 1001 Ontario St
- 759 W 10th Ave
- 752 W 9th Ave
- 880 La Terraza Blvd
- 819 W 7th Ave
- 1049 W 5th Ave
- 1531 Russell Place
- 401 S Vine St
- 1369 W 11th Ave
- 514 W 10th Ave
- 26 Bahama Dr
- 308 S Tulip St
- 967 W 2nd Ave
- 1756 Alhudson Dr
- 1711 Alhudson Dr
- 832 Casa de Oro Place
- 340 W 15th Ave Unit 5
- 320 W 8th Ave
- 509 W 2nd Ave
- 1620 Amanda Ln
- 1043 W 11th Ave
- 1033 W 11th Ave
- 1121 W 11th Ave
- 1106 W 12th Ave
- 1050 W 12th Ave
- 1112 W 12th Ave
- 1023 W 11th Ave
- 1030 W 12th Ave
- 1110 W 11th Ave
- 1126 W 12th Ave
- 1137 W 11th Ave
- 1050 W 11th Ave
- 1020 W 12th Ave
- 1013 W 11th Ave
- 1138 W 12th Ave
- 1136 W 11th Ave
- 1010 W 12th Ave
- 1149 W 11th Ave
- 1001 W 11th Ave
- 1035 Ontario St