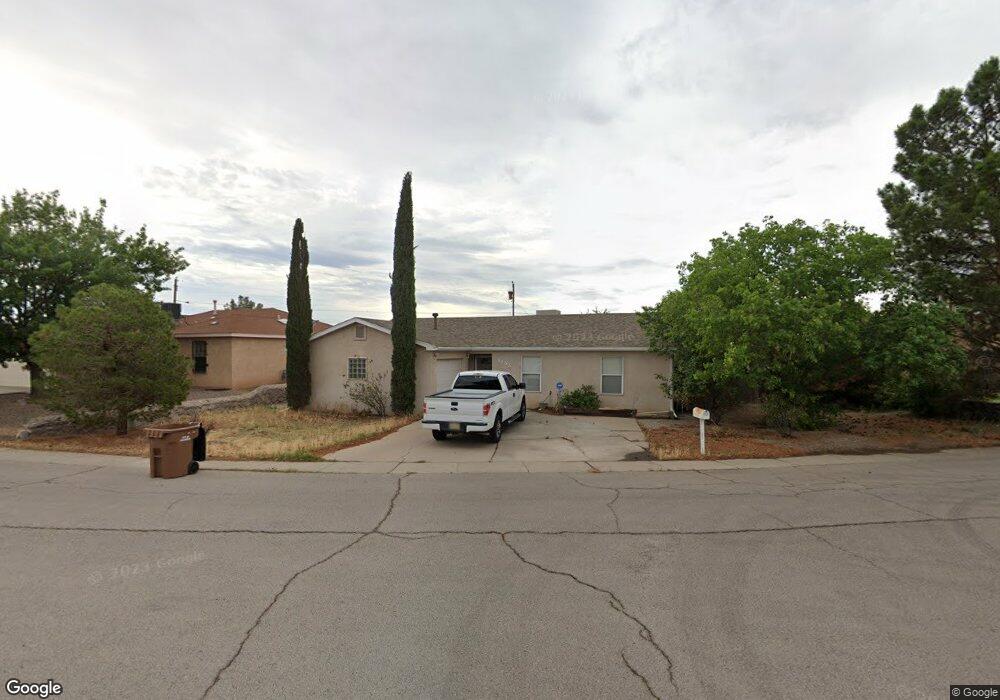
1105 Winton Cir Las Cruces, NM 88007
Estimated Value: $222,796 - $238,000
3
Beds
2
Baths
1,320
Sq Ft
$175/Sq Ft
Est. Value
About This Home
This home is located at 1105 Winton Cir, Las Cruces, NM 88007 and is currently estimated at $230,398, approximately $174 per square foot. 1105 Winton Cir is a home located in Dona Ana County with nearby schools including Mac Arthur Elementary School, Picacho Middle School, and Mayfield High School.
Ownership History
Date
Name
Owned For
Owner Type
Purchase Details
Closed on
Jan 20, 2017
Sold by
Romero Miguel B and Kirkland Jamie Heather
Bought by
Romero Miguel B
Current Estimated Value
Home Financials for this Owner
Home Financials are based on the most recent Mortgage that was taken out on this home.
Original Mortgage
$114,000
Outstanding Balance
$94,053
Interest Rate
4.16%
Mortgage Type
New Conventional
Estimated Equity
$136,345
Purchase Details
Closed on
Nov 21, 2005
Sold by
Young Charles G
Bought by
Romero Miguel B and Kirkland Jamie H
Home Financials for this Owner
Home Financials are based on the most recent Mortgage that was taken out on this home.
Original Mortgage
$132,914
Interest Rate
5.92%
Mortgage Type
FHA
Purchase Details
Closed on
Sep 2, 1999
Sold by
Don Elliott Jerry and Kaye Gina
Bought by
Young Charles G
Home Financials for this Owner
Home Financials are based on the most recent Mortgage that was taken out on this home.
Original Mortgage
$90,729
Interest Rate
7.58%
Mortgage Type
VA
Create a Home Valuation Report for This Property
The Home Valuation Report is an in-depth analysis detailing your home's value as well as a comparison with similar homes in the area
Home Values in the Area
Average Home Value in this Area
Purchase History
| Date | Buyer | Sale Price | Title Company |
|---|---|---|---|
| Romero Miguel B | -- | Southwestern Abstract & Titl | |
| Romero Miguel B | -- | Southwestern Abstract & Titl | |
| Young Charles G | -- | Southwestern Abstract & Titl |
Source: Public Records
Mortgage History
| Date | Status | Borrower | Loan Amount |
|---|---|---|---|
| Open | Romero Miguel B | $114,000 | |
| Closed | Romero Miguel B | $132,914 | |
| Previous Owner | Young Charles G | $90,729 |
Source: Public Records
Tax History Compared to Growth
Tax History
| Year | Tax Paid | Tax Assessment Tax Assessment Total Assessment is a certain percentage of the fair market value that is determined by local assessors to be the total taxable value of land and additions on the property. | Land | Improvement |
|---|---|---|---|---|
| 2024 | $1,437 | $47,185 | $5,901 | $41,284 |
| 2023 | $1,417 | $45,811 | $5,811 | $40,000 |
| 2022 | $1,395 | $44,477 | $5,761 | $38,716 |
| 2021 | $1,350 | $43,182 | $5,713 | $37,469 |
| 2020 | $1,317 | $41,924 | $5,666 | $36,258 |
| 2019 | $1,282 | $40,703 | $5,621 | $35,082 |
| 2018 | $1,238 | $39,518 | $5,577 | $33,941 |
| 2017 | $1,103 | $38,366 | $5,533 | $32,833 |
| 2016 | $1,118 | $38,366 | $5,533 | $32,833 |
| 2015 | $1,123 | $115,051 | $16,583 | $98,468 |
| 2014 | $1,090 | $111,700 | $16,100 | $95,600 |
Source: Public Records
Map
Nearby Homes
- 1716 Winton Dr
- 1845 Golden Dr
- 1914 Windsor Place
- 530 Linda Vista Rd
- 1479 Parker Rd
- 701 Parker Rd
- 1855 Cruse Ave
- 891 Chateau Dr
- 1095 Van Patten Ave
- 1245 Van Patten Ave
- 318 Linda Vista Rd
- 1000 N Melendres St
- 1212 Brownlee Ave
- 1944 Cruse Ave
- 2113 Windsor Place
- 2119 Windsor Place
- 2210 Avalon Dr
- 730 N Miranda St
- 2101 Briarwood Ln
- 811 McFie Ave
- 1065 Winton Cir
- 1109 Winton Cir
- 1160 Palmer Rd
- 1130 Palmer Rd
- 1610 Neleigh Dr
- 1114 Winton Cir
- 1113 Winton Cir
- 1100 Palmer Rd
- 1614 Neleigh Dr
- 1118 Winton Cir
- 1609 Neleigh Dr
- 1117 Winton Cir
- 1206 Palmer Rd
- 1613 Neleigh Dr
- 1210 Palmer Rd
- 1618 Neleigh Dr
- 1121 Winton Cir
- 1606 Winton Ct
- 1560 5th St
- 1050 Palmer Rd