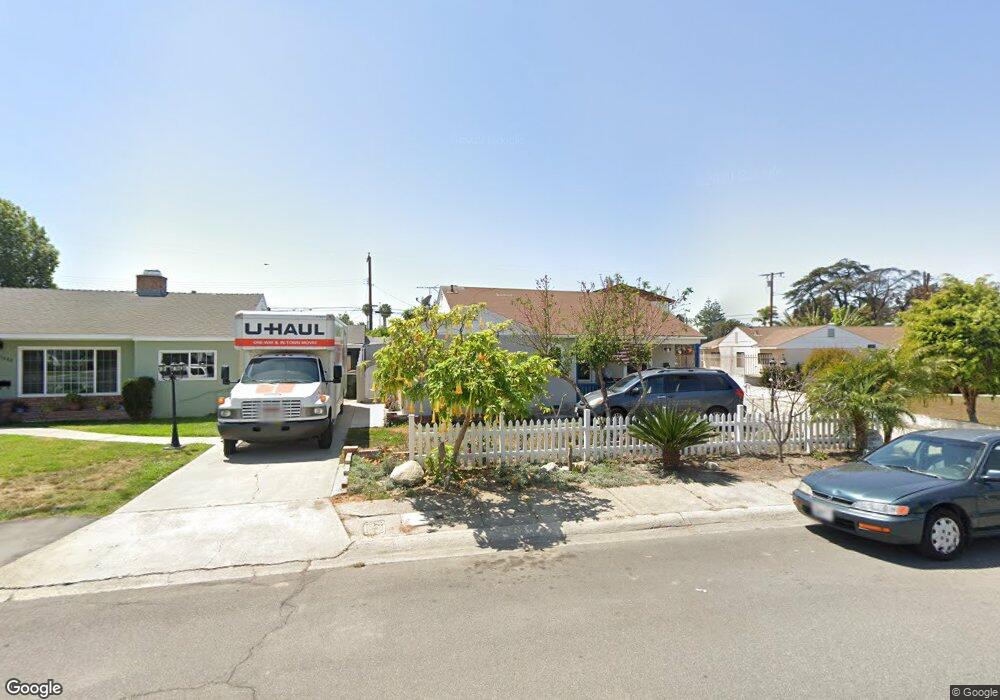
11052 Sherman Ave Garden Grove, CA 92843
Estimated Value: $968,240 - $1,030,000
2
Beds
2
Baths
1,481
Sq Ft
$679/Sq Ft
Est. Value
About This Home
This home is located at 11052 Sherman Ave, Garden Grove, CA 92843 and is currently estimated at $1,006,310, approximately $679 per square foot. 11052 Sherman Ave is a home located in Orange County with nearby schools including Stanley Elementary School, Garden Grove High School, and St. Columban School.
Ownership History
Date
Name
Owned For
Owner Type
Purchase Details
Closed on
May 7, 2019
Sold by
Nancy Hoan Le Revocable Living Trust
Bought by
Nancy Hoan Le Revocable Living Trust and Hai Trong Luu Revocable Living Trust
Current Estimated Value
Purchase Details
Closed on
Feb 22, 2007
Sold by
Le Nancy Hoan and Luu Hai Trong
Bought by
Le Nancy Hoan and Luu Kim Anh
Purchase Details
Closed on
Dec 26, 2003
Sold by
Luu Hai Trong
Bought by
Le Nancy Hoan
Purchase Details
Closed on
Oct 24, 2002
Sold by
Luu Hai Trong and Luu Hai Thanh
Bought by
Luu Hai Trong
Purchase Details
Closed on
Sep 18, 2002
Sold by
Luu Harrison Thanh and Luu Hai Thanh
Bought by
Luu Hai Thanh
Purchase Details
Closed on
May 26, 1999
Sold by
Luu Harrison Thanh
Bought by
Luu Harrison Thanh and Luu Hai Thanh
Purchase Details
Closed on
Feb 18, 1999
Sold by
Hai Luu
Bought by
Luu Harrison Thanh
Purchase Details
Closed on
Mar 29, 1995
Sold by
Luu Nancy
Bought by
Luu Hai T
Create a Home Valuation Report for This Property
The Home Valuation Report is an in-depth analysis detailing your home's value as well as a comparison with similar homes in the area
Home Values in the Area
Average Home Value in this Area
Purchase History
| Date | Buyer | Sale Price | Title Company |
|---|---|---|---|
| Nancy Hoan Le Revocable Living Trust | -- | None Available | |
| Le Nancy Hoan | -- | Accommodation | |
| Le Nancy Hoan | -- | Lawyers Title Company | |
| Le Nancy Hoan | -- | -- | |
| Luu Hai Trong | -- | Fidelity National Title | |
| Luu Hai Thanh | -- | Fidelity National Title | |
| Luu Harrison Thanh | -- | Chicago Title Co | |
| Luu Harrison Thanh | -- | Chicago Title Co | |
| Luu Hai T | -- | -- |
Source: Public Records
Tax History Compared to Growth
Tax History
| Year | Tax Paid | Tax Assessment Tax Assessment Total Assessment is a certain percentage of the fair market value that is determined by local assessors to be the total taxable value of land and additions on the property. | Land | Improvement |
|---|---|---|---|---|
| 2025 | $5,674 | $454,966 | $363,289 | $91,677 |
| 2024 | $5,674 | $446,046 | $356,166 | $89,880 |
| 2023 | $5,568 | $437,300 | $349,182 | $88,118 |
| 2022 | $5,444 | $428,726 | $342,335 | $86,391 |
| 2021 | $5,367 | $420,320 | $335,622 | $84,698 |
| 2020 | $5,302 | $416,011 | $332,181 | $83,830 |
| 2019 | $5,229 | $407,854 | $325,667 | $82,187 |
| 2018 | $5,101 | $399,857 | $319,281 | $80,576 |
| 2017 | $5,047 | $392,017 | $313,020 | $78,997 |
| 2016 | $4,795 | $384,331 | $306,882 | $77,449 |
| 2015 | $4,731 | $378,558 | $302,272 | $76,286 |
| 2014 | $4,621 | $371,143 | $296,351 | $74,792 |
Source: Public Records
Map
Nearby Homes
- 13312 Michael Rainford Cir
- 10836 Sonoma Ln
- 13611 Glenhaven Dr
- 13372 Jessica Dr
- 12677 8th St
- 12970 Newhope St
- 12851 Newhope St
- 10422 Bonnie Dr
- 12600 Euclid St Unit 4
- 12600 Euclid St Unit 19
- 10391 Mildred Ave
- 11052 Peppertree Ln
- 12555 Euclid St Unit 2
- 12555 Euclid St Unit 79
- 12555 Euclid St Unit 61
- 12555 S Euclid St Unit 32
- 13161 Adland St
- 13052 Rockinghorse Rd
- 12621 Strathmore Dr
- 12861 West St Unit 157
- 11062 Sherman Ave
- 11042 Sherman Ave
- 11072 Sherman Ave
- 11032 Sherman Ave
- 11082 Sherman Ave
- 11031 Sherman Ave
- 11092 Sherman Ave
- 11002 Sherman Ave
- 11101 Sherman Ave
- 11051 Paloma Ave
- 11081 Crosby Ave
- 11102 Sherman Ave
- 13122 Elmwood St
- 11102 Crosby Ave
- 11091 Crosby Ave
- 11112 Sherman Ave
- 11111 Sherman Ave
- 11122 Crosby Ave
- 13182 Stanrich Place
- 13172 Stanrich Place