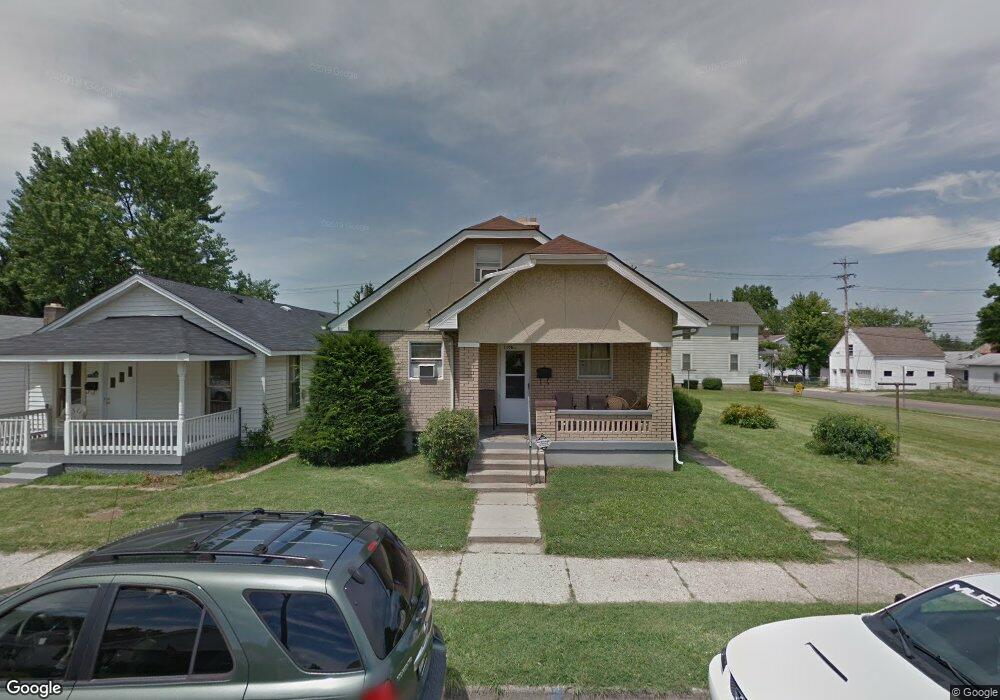
1106 Azel Ave Hamilton, OH 45013
Estimated Value: $132,000 - $153,732
3
Beds
2
Baths
1,700
Sq Ft
$84/Sq Ft
Est. Value
About This Home
This home is located at 1106 Azel Ave, Hamilton, OH 45013 and is currently estimated at $142,183, approximately $83 per square foot. 1106 Azel Ave is a home located in Butler County with nearby schools including Highland Elementary School, Wilson Middle School, and Hamilton High School Main Campus.
Ownership History
Date
Name
Owned For
Owner Type
Purchase Details
Closed on
Jul 23, 2020
Sold by
Nunn John M
Bought by
Mackdaddy Investments Llc
Current Estimated Value
Purchase Details
Closed on
Jul 14, 2020
Sold by
Brinker Lori
Bought by
Nunn John M
Purchase Details
Closed on
Jun 16, 2015
Sold by
Prater Rodney
Bought by
Brinker Lori
Purchase Details
Closed on
Aug 7, 2014
Sold by
Gumm Raymond and Gumm Edna
Bought by
Brinkler Lori and Prater Rodney
Home Financials for this Owner
Home Financials are based on the most recent Mortgage that was taken out on this home.
Original Mortgage
$40,000
Interest Rate
4.11%
Mortgage Type
New Conventional
Purchase Details
Closed on
May 20, 2009
Sold by
Hering Ramona
Bought by
Whalen Jacob
Purchase Details
Closed on
Apr 30, 2009
Sold by
Hering Ramona
Bought by
Samples Janet Faye and Samples Janet F
Purchase Details
Closed on
Aug 27, 2004
Sold by
Samples Janet F
Bought by
Samples Janet Faye and Janet Faye Samples Family Trust
Create a Home Valuation Report for This Property
The Home Valuation Report is an in-depth analysis detailing your home's value as well as a comparison with similar homes in the area
Home Values in the Area
Average Home Value in this Area
Purchase History
| Date | Buyer | Sale Price | Title Company |
|---|---|---|---|
| Mackdaddy Investments Llc | $86,000 | None Available | |
| Nunn John M | $47,000 | None Available | |
| Brinker Lori | -- | None Available | |
| Brinkler Lori | $65,000 | None Available | |
| Whalen Jacob | $40,800 | Attorney | |
| Samples Janet Faye | -- | Attorney | |
| Samples Janet Faye | -- | -- |
Source: Public Records
Mortgage History
| Date | Status | Borrower | Loan Amount |
|---|---|---|---|
| Previous Owner | Brinkler Lori | $40,000 |
Source: Public Records
Tax History
| Year | Tax Paid | Tax Assessment Tax Assessment Total Assessment is a certain percentage of the fair market value that is determined by local assessors to be the total taxable value of land and additions on the property. | Land | Improvement |
|---|---|---|---|---|
| 2025 | $1,528 | $35,270 | $4,570 | $30,700 |
| 2024 | $1,528 | $35,270 | $4,570 | $30,700 |
| 2023 | $1,521 | $35,270 | $4,570 | $30,700 |
| 2022 | $1,305 | $25,500 | $4,570 | $20,930 |
| 2021 | $1,144 | $24,620 | $4,570 | $20,050 |
| 2020 | $1,192 | $24,620 | $4,570 | $20,050 |
| 2019 | $1,129 | $23,000 | $4,990 | $18,010 |
| 2018 | $1,100 | $23,000 | $4,990 | $18,010 |
| 2017 | $668 | $23,000 | $4,990 | $18,010 |
| 2016 | $627 | $21,490 | $4,990 | $16,500 |
| 2015 | $623 | $21,490 | $4,990 | $16,500 |
| 2014 | $633 | $21,490 | $4,990 | $16,500 |
| 2013 | $633 | $26,780 | $4,990 | $21,790 |
Source: Public Records
Map
Nearby Homes
- 1116 Azel Ave
- 1355 Ross Ave
- 1263 Park Ave
- 64 Brookwood Ave
- 905 Virginia Ave
- 732 Millville Ave
- 444 N Dick Ave
- 30 S Washington Blvd
- 974 Westview Ave
- 760 Park Ave
- 540 Carlisle Ave
- 1020 Westview Ave
- 324 Sherman Ave
- 987 Carlisle Ave
- 975 Harrison Ave
- 936 Elizabeth Dr
- 609 Coralie St
- 201 Progress Ave
- 309 N F St
- 803 Cereal Ave
- 1108 Azel Ave
- 125 Kenworth Ave
- 1112 Azel Ave
- 1118 Azel Ave
- 1098 Azel Ave
- 1207 Western Ave
- 1205 Western Ave
- 1215 Western Ave
- 1120 Azel Ave
- 1201 Western Ave
- 1227 Western Ave
- 1227 Western Ave
- 1096 Azel Ave
- 1124 Azel Ave
- 1105 Azel Ave
- 1107 Azel Ave
- 1101 Azel Ave
- 1229 Western Ave
- 1185 Western Ave
- 1094 Azel Ave
Your Personal Tour Guide
Ask me questions while you tour the home.