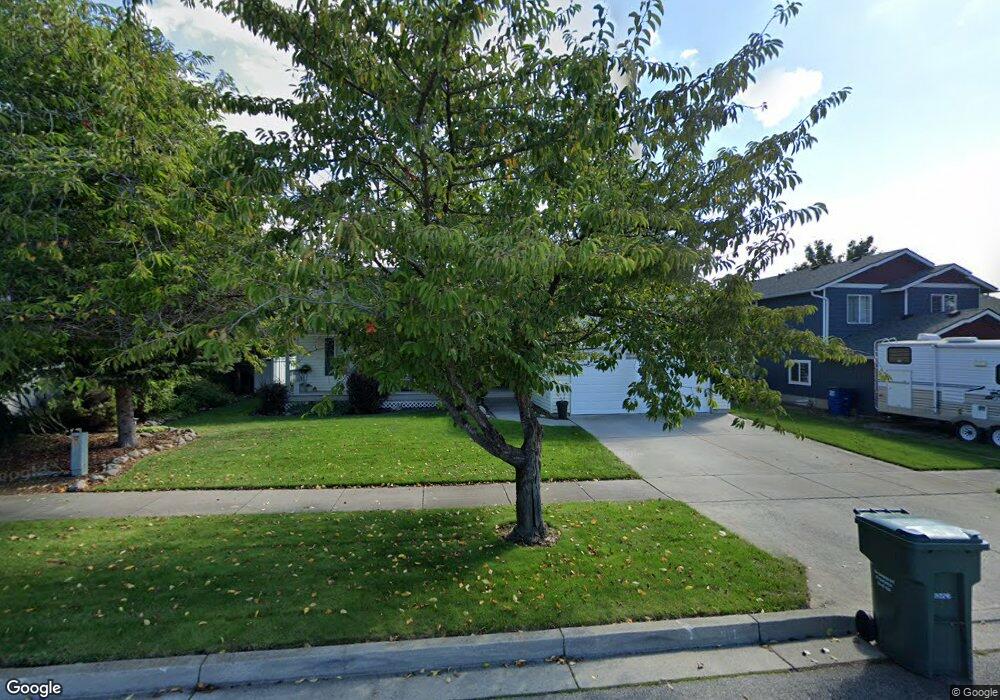
1106 E Autumn Crest Loop Post Falls, ID 83854
North Prairie NeighborhoodEstimated Value: $452,000 - $496,000
3
Beds
2
Baths
1,536
Sq Ft
$302/Sq Ft
Est. Value
About This Home
This home is located at 1106 E Autumn Crest Loop, Post Falls, ID 83854 and is currently estimated at $463,369, approximately $301 per square foot. 1106 E Autumn Crest Loop is a home located in Kootenai County with nearby schools including Prairie View Elementary School, Post Falls Middle School, and Post Falls High School.
Ownership History
Date
Name
Owned For
Owner Type
Purchase Details
Closed on
Oct 8, 2020
Sold by
Conger Jesse and Newell Morgan
Bought by
Toomey Russell I and Toomey Julia C
Current Estimated Value
Home Financials for this Owner
Home Financials are based on the most recent Mortgage that was taken out on this home.
Original Mortgage
$120,000
Outstanding Balance
$106,492
Interest Rate
2.9%
Mortgage Type
New Conventional
Estimated Equity
$356,877
Purchase Details
Closed on
Jul 30, 2018
Sold by
Ebrlein Frances and Eberlein Dianne L
Bought by
Conger Jesse and Newell Morgan
Home Financials for this Owner
Home Financials are based on the most recent Mortgage that was taken out on this home.
Original Mortgage
$229,090
Interest Rate
4.37%
Mortgage Type
FHA
Create a Home Valuation Report for This Property
The Home Valuation Report is an in-depth analysis detailing your home's value as well as a comparison with similar homes in the area
Home Values in the Area
Average Home Value in this Area
Purchase History
| Date | Buyer | Sale Price | Title Company |
|---|---|---|---|
| Toomey Russell I | -- | First American Ttl Kootenai | |
| Conger Jesse | -- | Alliance Title & Escrow Corp |
Source: Public Records
Mortgage History
| Date | Status | Borrower | Loan Amount |
|---|---|---|---|
| Open | Toomey Russell I | $120,000 | |
| Previous Owner | Conger Jesse | $229,090 |
Source: Public Records
Tax History
| Year | Tax Paid | Tax Assessment Tax Assessment Total Assessment is a certain percentage of the fair market value that is determined by local assessors to be the total taxable value of land and additions on the property. | Land | Improvement |
|---|---|---|---|---|
| 2025 | $1,708 | $439,910 | $165,000 | $274,910 |
| 2024 | $1,712 | $430,300 | $155,250 | $275,050 |
| 2023 | $1,712 | $447,550 | $172,500 | $275,050 |
| 2022 | $2,290 | $494,308 | $172,500 | $321,808 |
| 2021 | $1,980 | $318,270 | $115,000 | $203,270 |
| 2020 | $1,583 | $235,180 | $90,000 | $145,180 |
| 2019 | $1,517 | $216,590 | $80,000 | $136,590 |
| 2018 | $2,685 | $192,800 | $68,000 | $124,800 |
| 2017 | $2,615 | $172,040 | $50,000 | $122,040 |
| 2016 | $2,535 | $157,850 | $42,000 | $115,850 |
| 2015 | $1,160 | $141,660 | $36,000 | $105,660 |
| 2013 | $1,118 | $126,280 | $32,000 | $94,280 |
Source: Public Records
Map
Nearby Homes
- 1700 N Summer Hills Ct
- 1552 N McKelvy Ln
- 1544 N McKelvy Ln
- 987 E Healy Ave
- 1004 E Healy Ave
- 1016 E Healy Ave
- 936 E Healy
- 982 E Healy Ave
- 1535 N Tatum Dr
- 1324 E Yellowstone Ave
- 1207 E Horsehaven Ave
- 2103 N Mackenzie Dr
- 910 E Shasta Ave
- 2110 N Triumph Ct
- 1019 N Nellie Ct
- 514 E 13th Ave
- 2744 N Alfalfa Loop
- 1545 E Legion St
- 2238 N Chaffee St
- 2489 N Side Saddle Ln
- 1106 E Autumn Crest Loop
- 1104 E Autumn Crest Loop
- 1108 E Autumn Crest Loop
- 1609 N Quail Run Blvd
- 1607 Quail Run Blvd
- 1611 N Quail Run Blvd
- 1102 E Autumn Crest Loop
- 1002 E Singing Hills Dr
- 1003 E Autumn Crest Loop
- 1605 Quail Run Blvd
- 1700 N Autumn Crest Ct
- 1001 E Autumn Crest Loop
- 1610 N Autumn Crest Ct
- 1603 N Quail Run Blvd
- 1001 E Autumn Crest Loop
- 1000 E Singing Hills Dr
- 1701 N Quail Run Blvd
- 1004 E Autumn Crest Loop
- 1002 E Autumn Crest Loop
- 1004 E Autumn Crest Loop
Your Personal Tour Guide
Ask me questions while you tour the home.