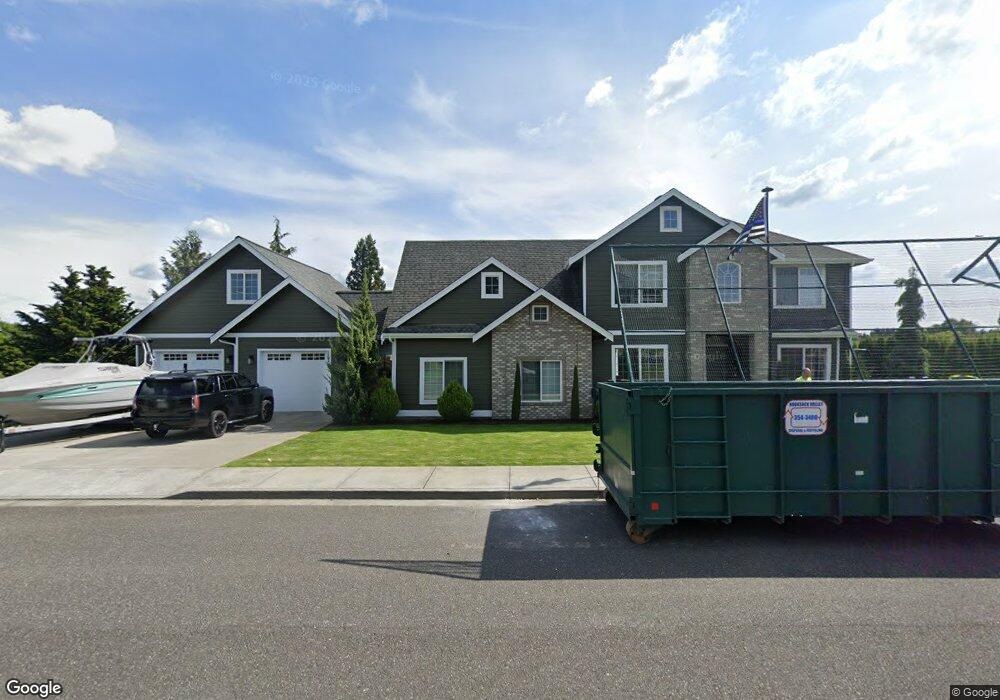
1106 E Front St Lynden, WA 98264
Estimated Value: $905,000 - $1,036,000
3
Beds
3
Baths
3,107
Sq Ft
$312/Sq Ft
Est. Value
About This Home
This home is located at 1106 E Front St, Lynden, WA 98264 and is currently estimated at $969,140, approximately $311 per square foot. 1106 E Front St is a home located in Whatcom County with nearby schools including Lynden High School, Lynden Christian Schools: Administration, and Lynden Christian School.
Ownership History
Date
Name
Owned For
Owner Type
Purchase Details
Closed on
Sep 17, 2021
Sold by
Boland David R and Boland Christine M
Bought by
Lefrancois Josh and Lefrancois Sadie
Current Estimated Value
Home Financials for this Owner
Home Financials are based on the most recent Mortgage that was taken out on this home.
Original Mortgage
$628,000
Outstanding Balance
$570,580
Interest Rate
2.7%
Mortgage Type
New Conventional
Estimated Equity
$398,560
Purchase Details
Closed on
Sep 10, 2002
Sold by
Kiel Leslie R and Bouma Leslie R
Bought by
Boland David R and Boland Christine M
Home Financials for this Owner
Home Financials are based on the most recent Mortgage that was taken out on this home.
Original Mortgage
$188,000
Interest Rate
6.24%
Purchase Details
Closed on
May 19, 1999
Sold by
Jansen Albert
Bought by
Bouma Chad A and Bouma Leslie R
Create a Home Valuation Report for This Property
The Home Valuation Report is an in-depth analysis detailing your home's value as well as a comparison with similar homes in the area
Home Values in the Area
Average Home Value in this Area
Purchase History
| Date | Buyer | Sale Price | Title Company |
|---|---|---|---|
| Lefrancois Josh | $785,000 | Whatcom Land Title | |
| Boland David R | $235,000 | First American Title Insuran | |
| Bouma Chad A | $34,000 | Chicago Title Insurance |
Source: Public Records
Mortgage History
| Date | Status | Borrower | Loan Amount |
|---|---|---|---|
| Open | Lefrancois Josh | $628,000 | |
| Previous Owner | Boland David R | $188,000 |
Source: Public Records
Tax History Compared to Growth
Tax History
| Year | Tax Paid | Tax Assessment Tax Assessment Total Assessment is a certain percentage of the fair market value that is determined by local assessors to be the total taxable value of land and additions on the property. | Land | Improvement |
|---|---|---|---|---|
| 2025 | $6,934 | $925,085 | $272,825 | $652,260 |
| 2024 | $6,443 | $914,933 | $242,500 | $672,433 |
| 2023 | $6,443 | $896,570 | $250,000 | $646,570 |
| 2022 | $6,309 | $827,984 | $207,587 | $620,397 |
| 2021 | $6,188 | $684,275 | $171,557 | $512,718 |
| 2020 | $5,421 | $610,976 | $153,180 | $457,796 |
| 2019 | $4,823 | $560,292 | $140,645 | $419,647 |
| 2018 | $5,271 | $511,028 | $128,122 | $382,906 |
| 2017 | $4,891 | $458,691 | $115,000 | $343,691 |
| 2016 | $4,599 | $452,698 | $88,000 | $364,698 |
| 2015 | $2,825 | $423,323 | $84,640 | $338,683 |
| 2014 | -- | $283,292 | $81,760 | $201,532 |
| 2013 | -- | $281,532 | $80,000 | $201,532 |
Source: Public Records
Map
Nearby Homes
- 1095 Terrace Dr
- 924 E Grover St
- 1178 E Grover St Unit 101
- 1077 Hampton Rd
- 1136 N Cascade Ct
- 1125 N Cascade Ct
- 8639 Bender Rd
- 1319 Bradley Ct
- 137 E Cedar Dr
- 107 Springview Dr
- 1660 Eastwood Way
- 214 Skipping Stone Loop
- 208 Skipping Stone Loop
- 220 Skipping Stone Loop
- 204 Skipping Stone Loop
- 1333 Bradley Meadows Ct
- 120 Skipping Stone Loop
- 231 Skipping Stone Loop
- 208 Riverwalk Dr
- 102 Riverwalk Dr
- 103 Terrace Dr
- 1107 Terrace Dr
- 112 Terrace Dr
- 1080 E Front St
- 1095 E Front St
- 111 Terrace Dr
- 1112 E Front St
- 1105 Terrace Dr
- 1113 E Front St
- 104 Terrace Dr
- 1103 Terrace Dr
- 0 Terrace Dr
- 1118 E Front St
- 1100 Terrace Dr
- 1119 E Front St
- 127 Terrace Dr
- 1005 E Front St
- 1124 E Front St
- 936 E Front St
- 1012 E Grover St