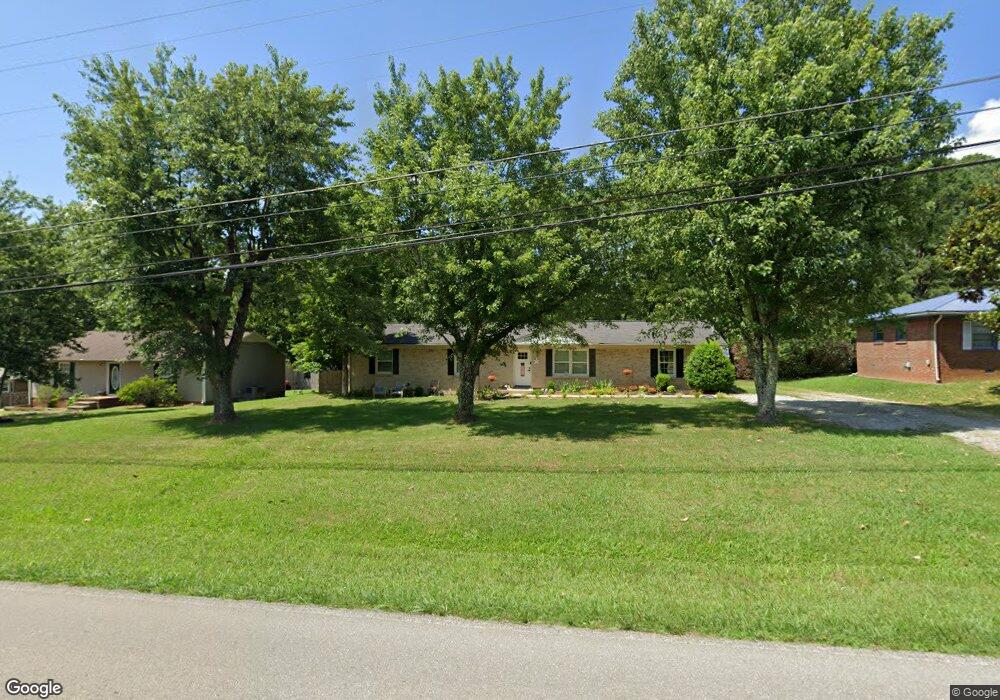
1106 Fall River Rd Lawrenceburg, TN 38464
Estimated Value: $205,155 - $283,000
--
Bed
1
Bath
1,700
Sq Ft
$139/Sq Ft
Est. Value
About This Home
This home is located at 1106 Fall River Rd, Lawrenceburg, TN 38464 and is currently estimated at $236,789, approximately $139 per square foot. 1106 Fall River Rd is a home located in Lawrence County with nearby schools including Lawrenceburg Public Elementary School, Ingram Sowell Elementary School, and David Crockett Elementary School.
Ownership History
Date
Name
Owned For
Owner Type
Purchase Details
Closed on
Jun 29, 2017
Sold by
Brown Gage N
Bought by
Gage Dawn M
Current Estimated Value
Home Financials for this Owner
Home Financials are based on the most recent Mortgage that was taken out on this home.
Original Mortgage
$87,000
Outstanding Balance
$72,366
Interest Rate
4.02%
Mortgage Type
Purchase Money Mortgage
Estimated Equity
$164,423
Purchase Details
Closed on
Mar 26, 2014
Sold by
Martin Cassie Lou
Bought by
Brown Gage N
Home Financials for this Owner
Home Financials are based on the most recent Mortgage that was taken out on this home.
Original Mortgage
$59,775
Interest Rate
4.3%
Mortgage Type
New Conventional
Purchase Details
Closed on
Feb 22, 2000
Bought by
Martin Cassie Lou
Purchase Details
Closed on
Jan 24, 1973
Bought by
Crowder Glynn Thomas
Create a Home Valuation Report for This Property
The Home Valuation Report is an in-depth analysis detailing your home's value as well as a comparison with similar homes in the area
Home Values in the Area
Average Home Value in this Area
Purchase History
| Date | Buyer | Sale Price | Title Company |
|---|---|---|---|
| Gage Dawn M | $87,000 | None Available | |
| Brown Gage N | $59,775 | -- | |
| Martin Cassie Lou | $57,000 | -- | |
| Crowder Glynn Thomas | -- | -- |
Source: Public Records
Mortgage History
| Date | Status | Borrower | Loan Amount |
|---|---|---|---|
| Open | Gage Dawn M | $87,000 | |
| Previous Owner | Brown Gage N | $59,775 |
Source: Public Records
Tax History Compared to Growth
Tax History
| Year | Tax Paid | Tax Assessment Tax Assessment Total Assessment is a certain percentage of the fair market value that is determined by local assessors to be the total taxable value of land and additions on the property. | Land | Improvement |
|---|---|---|---|---|
| 2025 | $1,289 | $41,475 | $0 | $0 |
| 2024 | $1,289 | $41,475 | $5,000 | $36,475 |
| 2023 | $1,289 | $41,475 | $5,000 | $36,475 |
| 2022 | $1,289 | $41,475 | $5,000 | $36,475 |
| 2021 | $890 | $20,250 | $2,000 | $18,250 |
| 2020 | $890 | $20,250 | $2,000 | $18,250 |
| 2019 | $890 | $20,250 | $2,000 | $18,250 |
| 2018 | $890 | $20,250 | $2,000 | $18,250 |
| 2017 | $890 | $20,250 | $2,000 | $18,250 |
| 2016 | $890 | $20,250 | $2,000 | $18,250 |
| 2015 | $843 | $20,250 | $2,000 | $18,250 |
| 2014 | $794 | $19,075 | $2,000 | $17,075 |
Source: Public Records
Map
Nearby Homes
- 1104 Fall River Rd
- 1108 Fall River Rd
- 1110 Fall River Rd
- 913 Dogwood Dr
- 1105 Hickory St
- 1107 Hickory St
- 1103 Hickory St
- 1109 Hickory St
- 1112 Fall River Rd
- 907 Dogwood Dr
- 1010 Fall River Rd
- 1111 Hickory St
- 1113 Fall River Rd
- 1113 Fall River
- 906 Dogwood Dr
- 1104 Hickory St
- 1102 Hickory St
- 1113 Hickory St
- 1106 Hickory St
- 1013 Hickory St