Estimated Value: $54,609
--
Bed
--
Bath
1,072
Sq Ft
$51/Sq Ft
Est. Value
About This Home
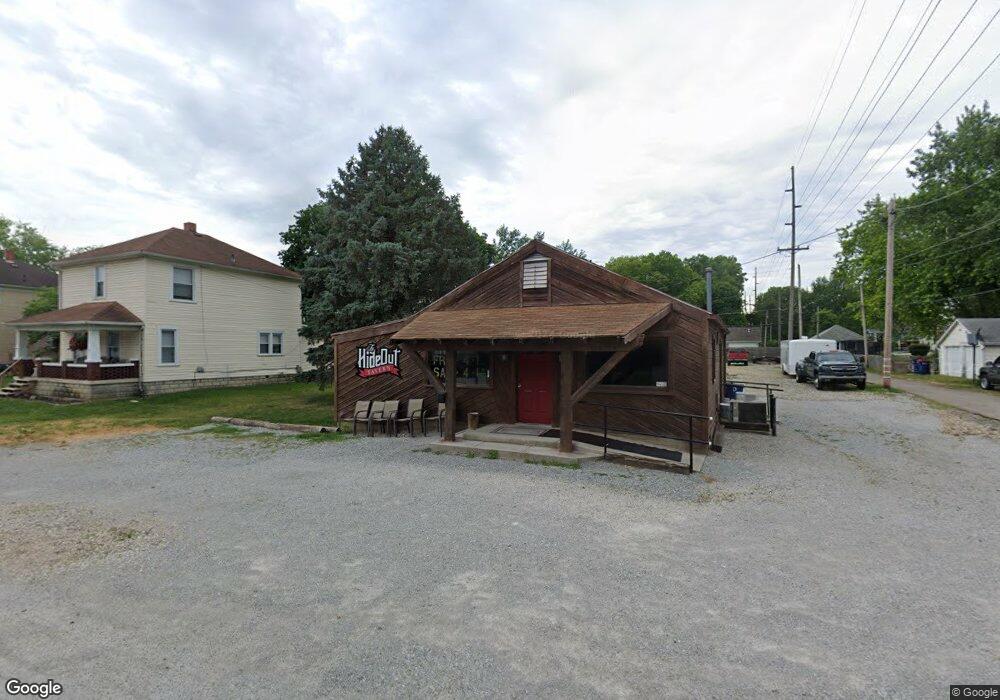
This home is located at 1106 Fisk St, Piqua, OH 45356 and is currently estimated at $54,609, approximately $50 per square foot. 1106 Fisk St is a home located in Miami County with nearby schools including Piqua Junior High School, Piqua High School, and Nicholas School.
Ownership History
Date
Name
Owned For
Owner Type
Purchase Details
Closed on
Mar 31, 2025
Sold by
Grimes Jeffrey J
Bought by
Grimes Jeffrey J and Grimes Stacy M
Current Estimated Value
Purchase Details
Closed on
Nov 22, 2017
Sold by
Poling Linda
Bought by
Grimes Jeffrey J
Purchase Details
Closed on
Nov 13, 2017
Sold by
Poling Linda and Poling David E
Bought by
Poling Linda
Purchase Details
Closed on
May 1, 1985
Bought by
Poling David Eugene
Create a Home Valuation Report for This Property
The Home Valuation Report is an in-depth analysis detailing your home's value as well as a comparison with similar homes in the area
Home Values in the Area
Average Home Value in this Area
Purchase History
| Date | Buyer | Sale Price | Title Company |
|---|---|---|---|
| Grimes Jeffrey J | -- | None Listed On Document | |
| Grimes Jeffrey J | $29,500 | -- | |
| Grimes Jeffrey J | $29,500 | -- | |
| Poling Linda | -- | -- | |
| Poling Linda | -- | -- | |
| Poling David Eugene | $65,000 | -- |
Source: Public Records
Tax History Compared to Growth
Tax History
| Year | Tax Paid | Tax Assessment Tax Assessment Total Assessment is a certain percentage of the fair market value that is determined by local assessors to be the total taxable value of land and additions on the property. | Land | Improvement |
|---|---|---|---|---|
| 2024 | $572 | $9,490 | $5,250 | $4,240 |
| 2023 | $572 | $9,490 | $5,250 | $4,240 |
| 2022 | $578 | $9,490 | $5,250 | $4,240 |
| 2021 | $584 | $9,490 | $5,250 | $4,240 |
| 2020 | $579 | $9,490 | $5,250 | $4,240 |
| 2019 | $579 | $9,490 | $5,250 | $4,240 |
| 2018 | $652 | $10,750 | $5,320 | $5,430 |
| 2017 | $658 | $10,750 | $5,320 | $5,430 |
| 2016 | $653 | $10,750 | $5,320 | $5,430 |
| 2015 | $634 | $10,750 | $5,320 | $5,430 |
| 2014 | $634 | $10,750 | $5,320 | $5,430 |
| 2013 | $626 | $10,750 | $5,320 | $5,430 |
Source: Public Records
Map
Nearby Homes