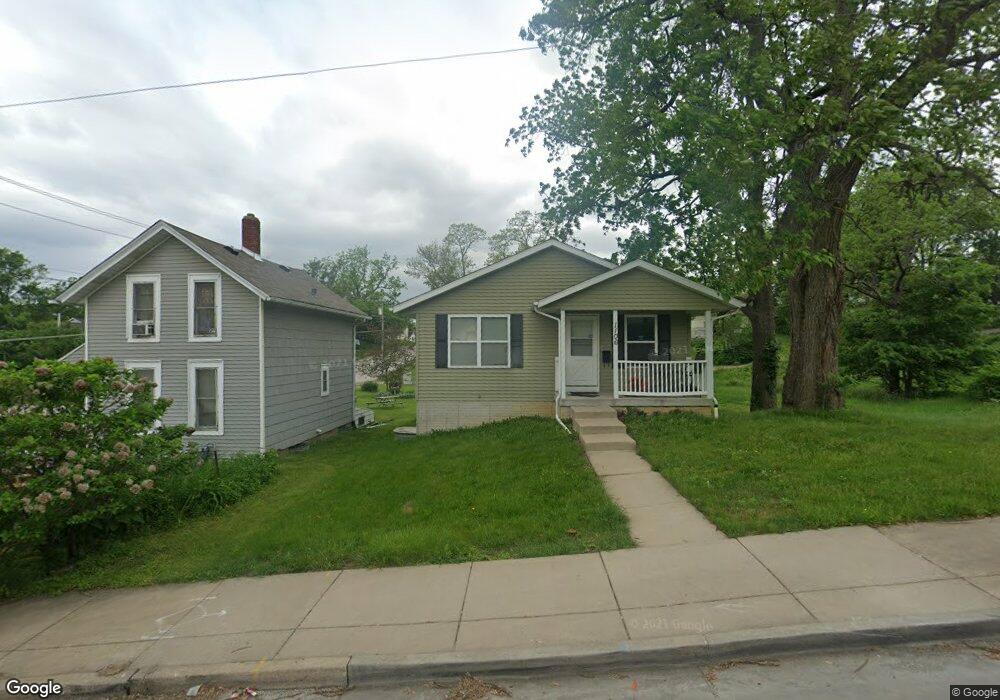
1106 N Ripley St Davenport, IA 52803
Central Davenport NeighborhoodEstimated Value: $108,354 - $162,000
3
Beds
1
Bath
1,092
Sq Ft
$117/Sq Ft
Est. Value
About This Home
This home is located at 1106 N Ripley St, Davenport, IA 52803 and is currently estimated at $127,589, approximately $116 per square foot. 1106 N Ripley St is a home located in Scott County with nearby schools including Walnut Hill Elementary School, Crofton Elementary School, and Casey County Middle School.
Ownership History
Date
Name
Owned For
Owner Type
Purchase Details
Closed on
Nov 22, 2010
Sold by
Habitat For Humanity Quad Cities
Bought by
Anderson Stephanie Dionne
Current Estimated Value
Home Financials for this Owner
Home Financials are based on the most recent Mortgage that was taken out on this home.
Original Mortgage
$72,270
Outstanding Balance
$33,041
Interest Rate
4.23%
Mortgage Type
Seller Take Back
Estimated Equity
$94,548
Purchase Details
Closed on
Jan 5, 2009
Sold by
Scott County
Bought by
Habitat For Humanity
Purchase Details
Closed on
Sep 14, 2007
Sold by
Hockaday L F and Hockaday Margaret
Bought by
Scott County
Create a Home Valuation Report for This Property
The Home Valuation Report is an in-depth analysis detailing your home's value as well as a comparison with similar homes in the area
Home Values in the Area
Average Home Value in this Area
Purchase History
| Date | Buyer | Sale Price | Title Company |
|---|---|---|---|
| Anderson Stephanie Dionne | $73,000 | None Available | |
| Habitat For Humanity | -- | None Available | |
| Scott County | $1,765 | None Available |
Source: Public Records
Mortgage History
| Date | Status | Borrower | Loan Amount |
|---|---|---|---|
| Open | Anderson Stephanie Dionne | $72,270 |
Source: Public Records
Tax History Compared to Growth
Tax History
| Year | Tax Paid | Tax Assessment Tax Assessment Total Assessment is a certain percentage of the fair market value that is determined by local assessors to be the total taxable value of land and additions on the property. | Land | Improvement |
|---|---|---|---|---|
| 2025 | $1,290 | $82,400 | $13,650 | $68,750 |
| 2024 | $2,022 | $82,400 | $13,650 | $68,750 |
| 2023 | $2,960 | $82,400 | $13,650 | $68,750 |
| 2022 | $2,589 | $92,530 | $6,720 | $85,810 |
| 2021 | $1,794 | $92,530 | $6,720 | $85,810 |
| 2020 | $2,012 | $73,420 | $6,720 | $66,700 |
| 2019 | $1,435 | $66,110 | $6,720 | $59,390 |
| 2018 | $1,215 | $66,110 | $6,720 | $59,390 |
| 2017 | $368 | $66,110 | $6,720 | $59,390 |
| 2016 | $1,510 | $58,812 | $0 | $0 |
| 2015 | $1,098 | $0 | $0 | $0 |
| 2014 | $448 | $0 | $0 | $0 |
| 2013 | $278 | $0 | $0 | $0 |
| 2012 | -- | $29,406 | $7,500 | $21,906 |
Source: Public Records
Map
Nearby Homes