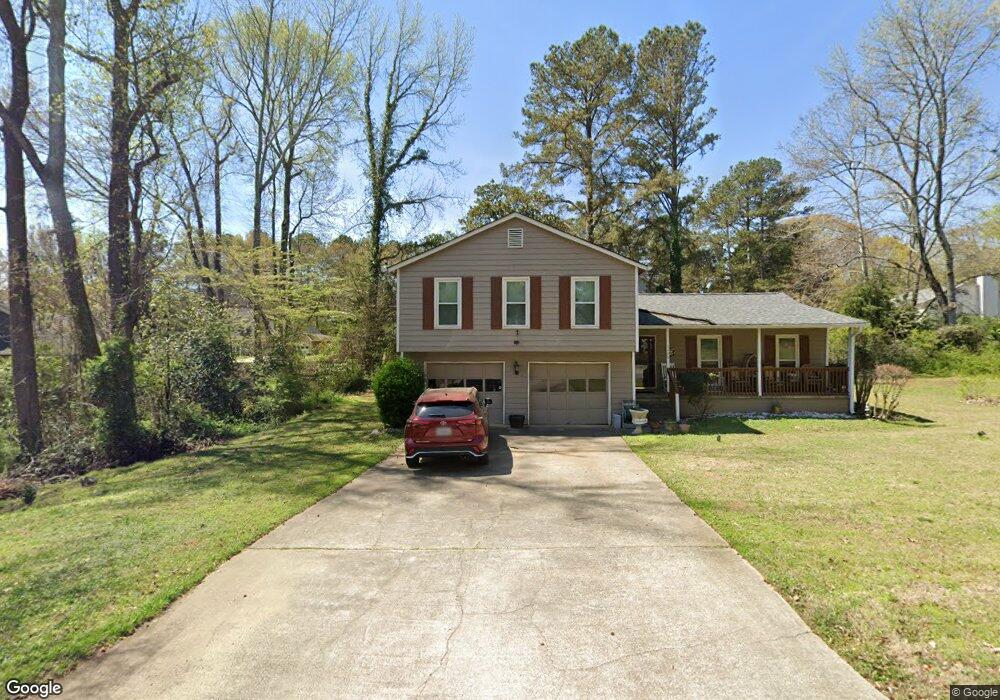
1106 Sugar Springs Dr SW Unit 2 Marietta, GA 30008
Southwestern Marietta NeighborhoodEstimated Value: $320,206 - $386,000
3
Beds
2
Baths
1,546
Sq Ft
$234/Sq Ft
Est. Value
About This Home
This home is located at 1106 Sugar Springs Dr SW Unit 2, Marietta, GA 30008 and is currently estimated at $362,302, approximately $234 per square foot. 1106 Sugar Springs Dr SW Unit 2 is a home located in Cobb County with nearby schools including Dunleith Elementary School, Marietta Sixth Grade Academy, and Marietta Middle School.
Ownership History
Date
Name
Owned For
Owner Type
Purchase Details
Closed on
Apr 25, 2003
Sold by
Coburn Matthew and Coburn Heather
Bought by
Poindexter Norma
Current Estimated Value
Home Financials for this Owner
Home Financials are based on the most recent Mortgage that was taken out on this home.
Original Mortgage
$154,574
Outstanding Balance
$66,599
Interest Rate
5.79%
Mortgage Type
FHA
Estimated Equity
$295,703
Purchase Details
Closed on
Aug 30, 2002
Sold by
Hacker Felicia R and Hacker Tyrone
Bought by
Coburn Heather and Coburn Matthew
Home Financials for this Owner
Home Financials are based on the most recent Mortgage that was taken out on this home.
Original Mortgage
$113,490
Interest Rate
6.4%
Mortgage Type
New Conventional
Purchase Details
Closed on
Feb 24, 2002
Sold by
Flippo Michael E and Flippo Cheryl B
Bought by
Hacker Felicia R and Hacker Tyrone
Purchase Details
Closed on
Feb 24, 1994
Sold by
Flippo Michael E Cheryl B
Bought by
Hacker Felicia R Tyrone
Create a Home Valuation Report for This Property
The Home Valuation Report is an in-depth analysis detailing your home's value as well as a comparison with similar homes in the area
Home Values in the Area
Average Home Value in this Area
Purchase History
| Date | Buyer | Sale Price | Title Company |
|---|---|---|---|
| Poindexter Norma | $157,200 | -- | |
| Coburn Heather | $126,100 | -- | |
| Hacker Felicia R | -- | -- | |
| Hacker Felicia R Tyrone | $16,500 | -- |
Source: Public Records
Mortgage History
| Date | Status | Borrower | Loan Amount |
|---|---|---|---|
| Open | Poindexter Norma | $154,574 | |
| Previous Owner | Coburn Heather | $113,490 | |
| Closed | Hacker Felicia R Tyrone | -- |
Source: Public Records
Tax History Compared to Growth
Tax History
| Year | Tax Paid | Tax Assessment Tax Assessment Total Assessment is a certain percentage of the fair market value that is determined by local assessors to be the total taxable value of land and additions on the property. | Land | Improvement |
|---|---|---|---|---|
| 2025 | $403 | $125,996 | $40,000 | $85,996 |
| 2024 | $403 | $131,820 | $38,000 | $93,820 |
| 2023 | $251 | $131,820 | $38,000 | $93,820 |
| 2022 | $403 | $91,364 | $38,000 | $53,364 |
| 2021 | $415 | $91,364 | $38,000 | $53,364 |
| 2020 | $412 | $67,692 | $26,000 | $41,692 |
| 2019 | $412 | $65,692 | $24,000 | $41,692 |
| 2018 | $387 | $54,936 | $19,200 | $35,736 |
| 2017 | $270 | $48,936 | $13,200 | $35,736 |
| 2016 | $183 | $36,224 | $7,200 | $29,024 |
| 2015 | $200 | $36,224 | $7,200 | $29,024 |
| 2014 | $207 | $36,224 | $0 | $0 |
Source: Public Records
Map
Nearby Homes
- 1230 Arden Dr SW
- 1166 Booth Rd SW Unit 407
- 1166 Booth Rd SW Unit 205
- 1166 Booth Rd SW Unit 906
- 1166 Booth Rd SW Unit 908
- 1166 Booth Rd SW Unit 610
- 393 Cedar Trace SW Unit 1
- 1038 Arden Dr SW
- 264 Juliet Ln SW
- 994 Powder Springs St
- 852 Hickory Dr SW
- 644 Laurel Wood Dr SW
- 701 Springhollow Ln SW
- 1048 Brownstone Dr Unit 3
- 1383 Natchez Trace SW
- 1305 Surrey Ln SW
- 1300 Surrey Ln SW
- 243 Brownstone Cir Unit 25
- 1430 Longwood Dr SW
- 1092 Sugar Springs Dr SW
- 776 Sugar Springs Ln SW
- 770 Sugar Springs Ln SW
- 587 Sugar Springs Ct SW
- 1111 Sugar Springs Dr SW Unit 2
- 1101 Sugar Springs Dr SW
- 775 Sugar Springs Ln SW
- 1121 Sugar Springs Dr SW
- 1091 Sugar Springs Dr SW Unit 1
- 563 Sugar Springs Ct SW Unit 563
- 563 Sugar Springs Ct SW
- 760 Sugar Springs Ln SW
- 769 Sugar Springs Ln SW Unit 2
- 1131 Sugar Springs Dr SW
- 1087 Sugar Springs Dr SW Unit 1
- 586 Sugar Springs Ct SW
- 1090 Oregon Trail SW
- 759 Sugar Springs Ln SW
- 1080 Oregon Trail SW
- 750 Sugar Springs Ln SW