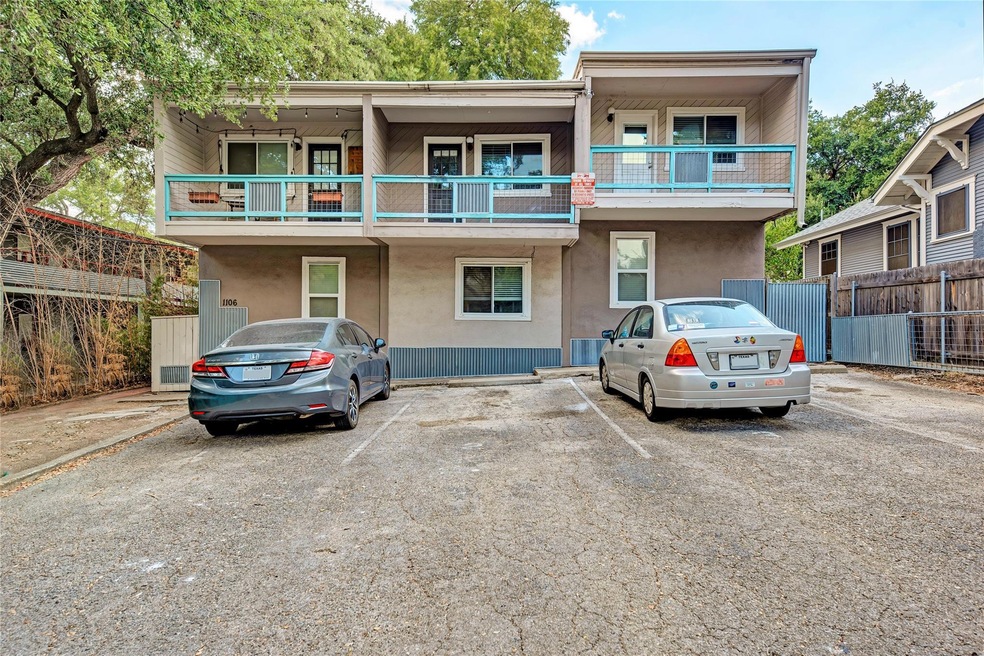


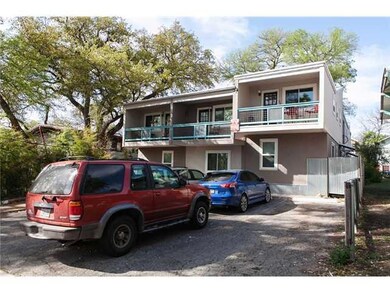

1106 W 22nd St Unit 9 Austin, TX 78705
West Campus NeighborhoodHighlights
- 1-Story Property
- Dogs and Cats Allowed
- South Facing Home
- Bryker Woods Elementary School Rated A
- Washer and Dryer
About This Home
Stylish Condo Living in Prime West Campus Location
Experience the perfect blend of comfort and convenience at Mark Twain #9, a charming condo located in the heart of West Campus, just a short walk from The University of Texas at Austin. This well-maintained unit offers an unbeatable location for students, faculty, or anyone looking to enjoy the vibrant energy of Central Austin.
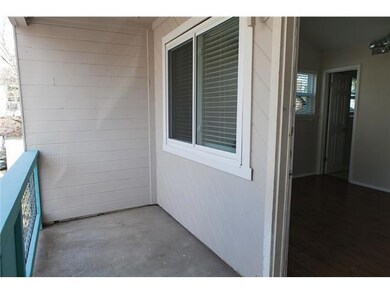
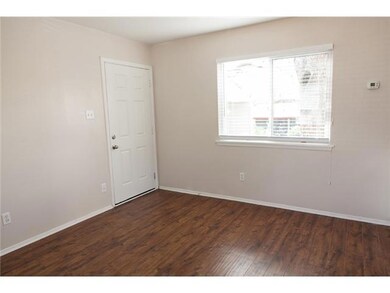
Inside, you’ll find a smart, functional layout with two spacious bedrooms, two full bathrooms, and a cozy living area ideal for relaxing or entertaining. The kitchen features modern appliances, plenty of cabinet space, and a convenient breakfast bar. With ample natural light, in-unit laundry, and reserved parking, this home offers all the essentials for stress-free living.
Set within a secure, gated community, Mark Twain #9 provides peace of mind while keeping you close to everything—campus, coffee shops, restaurants, and public transit are all just steps away.
?? 2 Bedrooms | ?? 2 Bathrooms
?? 1106 W 22nd Street, Unit #9 | Austin, TX 78705
????? Walk to UT | ??? Reserved Parking | ?? In-Unit Laundry
Whether you're seeking a personal residence or a solid investment property in a high-demand rental market, Mark Twain #9 delivers location, lifestyle, and long-term value.
Listing Agent
Campus & Central Properties Brokerage Phone: (512) 512-5679 License #0413931 Listed on: 07/31/2025
Property Details
Home Type
- Apartment
Est. Annual Taxes
- $5,054
Year Built
- Built in 1974
Lot Details
- 849 Sq Ft Lot
- South Facing Home
Interior Spaces
- 504 Sq Ft Home
- 1-Story Property
- Washer and Dryer
Kitchen
- Oven
- Microwave
- Dishwasher
Bedrooms and Bathrooms
- 1 Main Level Bedroom
- 1 Full Bathroom
Schools
- Bryker Woods Elementary School
- O Henry Middle School
- Austin High School
Listing and Financial Details
- Security Deposit $1,200
- Tenant pays for all utilities
- The owner pays for common area maintenance, exterior maintenance, HVAC maintenance, insurance, management, roof maintenance
- 12 Month Lease Term
- $100 Application Fee
- Assessor Parcel Number 01130021100000
Community Details
Overview
- 9 Units
- 1106 W 22Nd Street Condo Subdivision
- Property managed by Campus & Central Properties
Pet Policy
- Pet Deposit $1,200
- Dogs and Cats Allowed
Map
Source: Unlock MLS (Austin Board of REALTORS®)
MLS Number: 2894201
APN: 832516
Disclaimer: Certain information contained herein is derived from information provided by parties other than Homes.com. All information provided is deemed reliable, but is not guaranteed to be accurate and should be independently verified.
![]() Based on information from the Austin Board of REALTORS® (alternatively, from ACTRIS). Neither the Board nor ACTRIS guarantees or is in any way responsible for its accuracy. All data is provided “AS IS” and with all faults. Data maintained by the Board or ACTRIS may not reflect all real estate activity in the market.
Based on information from the Austin Board of REALTORS® (alternatively, from ACTRIS). Neither the Board nor ACTRIS guarantees or is in any way responsible for its accuracy. All data is provided “AS IS” and with all faults. Data maintained by the Board or ACTRIS may not reflect all real estate activity in the market.
Information being provided is for consumers’ personal, non-commercial use and may not be used for any purpose other than to identify prospective properties consumers may be interested in purchasing.
The Digital Millennium Copyright Act of 1998, 17 U.S.C. § 512 (the “DMCA”) provides recourse for copyright owners who believe that material appearing on the Internet infringes their rights under U.S. copyright law. If you believe in good faith that any content or material made available in connection with our website or services infringes your copyright, you (or your agent) may send us a notice requesting that the content or material be removed, or access to it blocked.
Notices must be sent in writing by email to DMCAnotice@MLSGrid.com.
The DMCA requires that your notice of alleged copyright infringement include the following information:
(1) description of the copyrighted work that is the subject of claimed infringement;
(2) description of the alleged infringing content and information sufficient to permit us to locate the content;
(3) contact information for you, including your address, telephone number and email address;
(4) a statement by you that you have a good faith belief that the content in the manner complained of is not authorized by the copyright owner, or its agent, or by the operation of any law;
(5) a statement by you, signed under penalty of perjury, that the information in the notification is accurate and that you have the authority to enforce the copyrights that are claimed to be infringed; and
(6) a physical or electronic signature of the copyright owner or a person authorized to act on the copyright owner’s behalf. Failure to include all of the above information may result in the delay of the processing of your complaint.
- 1110 W 22nd St Unit 2
- 1110 W 22nd St Unit 16
- 1910 Robbins Place Unit 207
- 1909 David St
- 2300 Leon St Unit 202
- 1010 W 23 St Unit 15
- 1010 W 23rd St Unit 4
- 1010 W 23rd St Unit 16
- 2216 San Gabriel St Unit 108
- 912 W 22nd St Unit 201
- 914 W 22nd 1 2 St Unit 304
- 1818 Vance Cir
- 915 W 23rd St Unit 108
- 1905 San Gabriel St Unit 105
- 2205 N Lamar Blvd Unit 114
- 2401 Leon St Unit 306
- 2401 Leon St Unit 110
- 2404 Longview St Unit 105
- 2408 Longview St Unit 113
- 1806 Pearl St
- 1106 W 22nd St Unit 5
- 1106 W 22nd St Unit 4
- 1102 W 22nd St Unit B
- 1102 W 22nd St
- 1107 W 22nd St
- 1107 W 22nd St
- 1110 W 22nd St Unit 4
- 1100 W 22nd St
- 1111 W St
- 1115 W 22 1 2 St
- 2207 Leon St Unit 109
- 2207 Leon St Unit 205
- 2207 Leon St Unit 303
- 2207 Leon St Unit 306
- 2207 Leon St Unit 203
- 2207 Leon St Unit 304
- 1910 Robbins Place Unit 208
- 1919 Robbins Place
- 1910 Robbins Place
- 1204 W 22nd St Unit A
