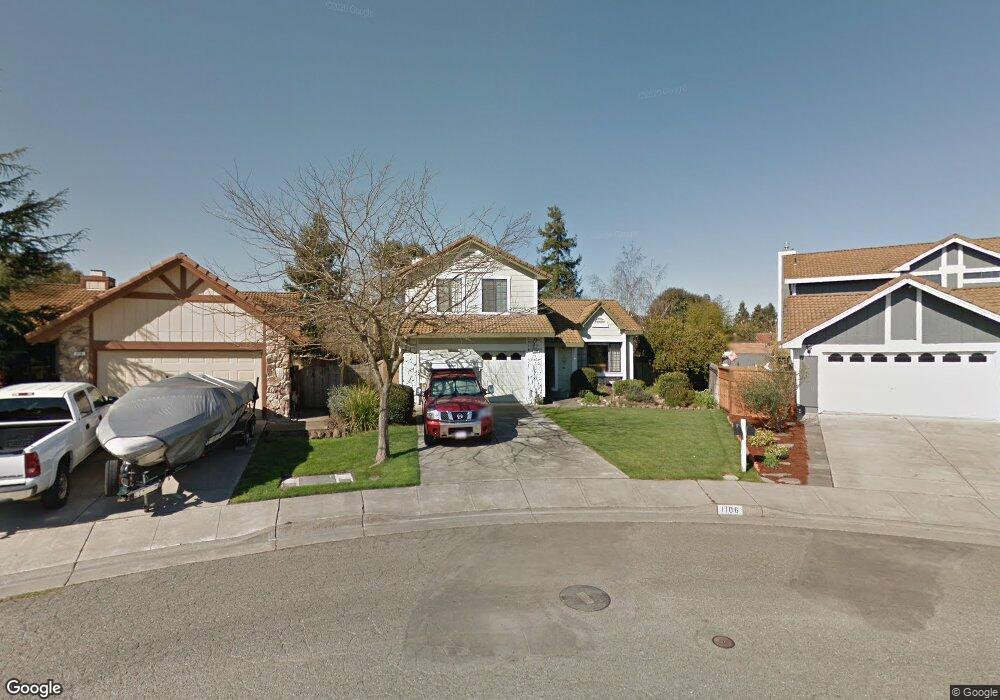
1106 Wieling Way Petaluma, CA 94954
Adobe NeighborhoodEstimated Value: $818,000 - $900,156
3
Beds
3
Baths
1,822
Sq Ft
$473/Sq Ft
Est. Value
About This Home
This home is located at 1106 Wieling Way, Petaluma, CA 94954 and is currently estimated at $861,039, approximately $472 per square foot. 1106 Wieling Way is a home located in Sonoma County with nearby schools including La Tercera Elementary School, Kenilworth Junior High School, and Casa Grande High School.
Ownership History
Date
Name
Owned For
Owner Type
Purchase Details
Closed on
Apr 10, 2024
Sold by
Smith Tyson R
Bought by
Smith Kara A
Current Estimated Value
Purchase Details
Closed on
Jan 6, 2016
Sold by
Compari Gary A and Bypass Trust Of The Gary A Com
Bought by
Smith Tyson R and Smith Kara A
Home Financials for this Owner
Home Financials are based on the most recent Mortgage that was taken out on this home.
Original Mortgage
$472,800
Interest Rate
3.92%
Mortgage Type
VA
Purchase Details
Closed on
May 25, 2006
Sold by
Compari Gary A A and Compari Gary A
Bought by
The Bypass Trust Of The Gary A & Sandra
Purchase Details
Closed on
Oct 21, 2003
Sold by
Compari Gary A and Compari Sandra
Bought by
Compari Gary A and Compari Sandra
Create a Home Valuation Report for This Property
The Home Valuation Report is an in-depth analysis detailing your home's value as well as a comparison with similar homes in the area
Home Values in the Area
Average Home Value in this Area
Purchase History
| Date | Buyer | Sale Price | Title Company |
|---|---|---|---|
| Smith Kara A | -- | None Listed On Document | |
| Smith Tyson R | $591,000 | North Coast Title Co | |
| The Bypass Trust Of The Gary A & Sandra | -- | None Available | |
| Compari Gary A | -- | -- | |
| Compari Gary A | -- | -- |
Source: Public Records
Mortgage History
| Date | Status | Borrower | Loan Amount |
|---|---|---|---|
| Previous Owner | Smith Tyson R | $472,800 |
Source: Public Records
Tax History
| Year | Tax Paid | Tax Assessment Tax Assessment Total Assessment is a certain percentage of the fair market value that is determined by local assessors to be the total taxable value of land and additions on the property. | Land | Improvement |
|---|---|---|---|---|
| 2025 | $7,593 | $699,616 | $278,188 | $421,428 |
| 2024 | $7,593 | $685,899 | $272,734 | $413,165 |
| 2023 | $7,593 | $672,451 | $267,387 | $405,064 |
| 2022 | $7,415 | $659,267 | $262,145 | $397,122 |
| 2021 | $7,327 | $646,341 | $257,005 | $389,336 |
| 2020 | $7,378 | $639,714 | $254,370 | $385,344 |
| 2019 | $7,302 | $627,172 | $249,383 | $377,789 |
| 2018 | $7,088 | $614,876 | $244,494 | $370,382 |
| 2017 | $6,983 | $602,820 | $239,700 | $363,120 |
| 2016 | $3,802 | $332,059 | $134,723 | $197,336 |
| 2015 | $3,703 | $327,072 | $132,700 | $194,372 |
| 2014 | $3,665 | $320,666 | $130,101 | $190,565 |
Source: Public Records
Map
Nearby Homes
- 1280 Saint Francis Dr
- 1212 Del Rancho Way
- 601 Marylyn Cir Unit 21
- 1173 River Pine Cir
- 1636 Sarkesian Dr
- 21 Alta Dr
- 1805 Alvarado St
- 417 Jacquelyn Ln
- 2 Wedgewood Ct
- 533 Albert Way
- 586 Sapphire St
- 11 Montclair Ct
- 530 Jade St
- 534 Jade St
- 2001 Willow Dr
- 1321 Mcneil Ave
- 1713 Alhambra Ct
- 316 Ely Blvd S
- 0 Lakeville St
- 320 Vallejo St
- 1110 Wieling Way
- 1102 Wieling Way
- 1518 Anna Way
- 1514 Anna Way
- 1522 Anna Way
- 1114 Wieling Way
- 1115 Wieling Way
- 1118 Wieling Way
- 1101 Daniel Dr
- 1526 Anna Way
- 1144 S Mcdowell Blvd
- 1119 Wieling Way
- 1140 S Mcdowell Blvd
- 1148 S Mcdowell Blvd
- 1122 Wieling Way
- 1136 S Mcdowell Blvd
- 1105 Daniel Dr
- 1120 Daniel Dr
- 1152 S Mcdowell Blvd
- 1519 Anna Way