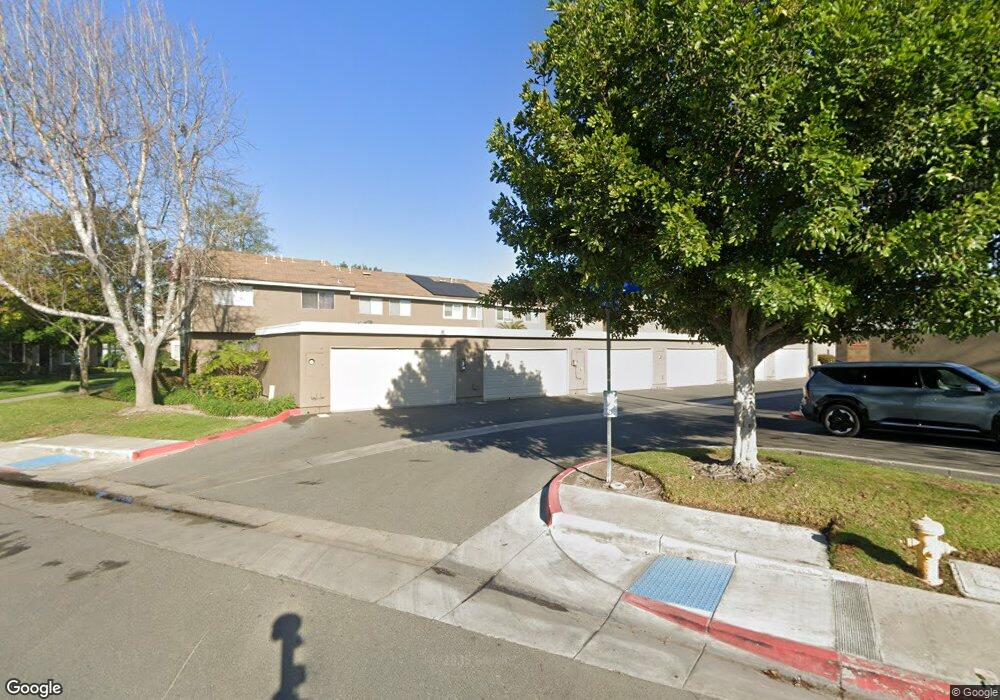
11067 Radcliff Way Stanton, CA 90680
Estimated Value: $647,000 - $674,000
3
Beds
2
Baths
1,159
Sq Ft
$566/Sq Ft
Est. Value
About This Home
This home is located at 11067 Radcliff Way, Stanton, CA 90680 and is currently estimated at $656,296, approximately $566 per square foot. 11067 Radcliff Way is a home located in Orange County with nearby schools including Bryant Elementary School, Hilton D. Bell Intermediate School, and Pacifica High School.
Ownership History
Date
Name
Owned For
Owner Type
Purchase Details
Closed on
Aug 13, 2019
Sold by
Runez Jowie and Runez Annette A
Bought by
Runez Jowie and Runez Annette
Current Estimated Value
Purchase Details
Closed on
Jan 26, 2007
Sold by
Runez Jowie
Bought by
Runez Jowie and Runez Annette A
Home Financials for this Owner
Home Financials are based on the most recent Mortgage that was taken out on this home.
Original Mortgage
$400,500
Outstanding Balance
$258,237
Interest Rate
7.58%
Mortgage Type
New Conventional
Estimated Equity
$398,059
Purchase Details
Closed on
Apr 24, 2000
Sold by
Benjamin Felipe and Elmie Elizabeth Elmie
Bought by
Runez Jowie
Home Financials for this Owner
Home Financials are based on the most recent Mortgage that was taken out on this home.
Original Mortgage
$127,500
Interest Rate
10.2%
Mortgage Type
Purchase Money Mortgage
Create a Home Valuation Report for This Property
The Home Valuation Report is an in-depth analysis detailing your home's value as well as a comparison with similar homes in the area
Home Values in the Area
Average Home Value in this Area
Purchase History
| Date | Buyer | Sale Price | Title Company |
|---|---|---|---|
| Runez Jowie | -- | None Available | |
| Runez Jowie | -- | Alliance Title | |
| Runez Jowie | -- | New Century Title Company | |
| Runez Jowie | -- | New Century Title Company |
Source: Public Records
Mortgage History
| Date | Status | Borrower | Loan Amount |
|---|---|---|---|
| Open | Runez Jowie | $400,500 | |
| Previous Owner | Runez Jowie | $127,500 |
Source: Public Records
Tax History
| Year | Tax Paid | Tax Assessment Tax Assessment Total Assessment is a certain percentage of the fair market value that is determined by local assessors to be the total taxable value of land and additions on the property. | Land | Improvement |
|---|---|---|---|---|
| 2025 | $2,754 | $218,477 | $128,282 | $90,195 |
| 2024 | $2,754 | $214,194 | $125,767 | $88,427 |
| 2023 | $2,700 | $209,995 | $123,301 | $86,694 |
| 2022 | $2,657 | $205,878 | $120,883 | $84,995 |
| 2021 | $2,631 | $201,842 | $118,513 | $83,329 |
| 2020 | $2,599 | $199,773 | $117,298 | $82,475 |
| 2019 | $2,538 | $195,856 | $114,998 | $80,858 |
| 2018 | $2,495 | $192,016 | $112,743 | $79,273 |
| 2017 | $2,460 | $188,251 | $110,532 | $77,719 |
| 2016 | $2,361 | $184,560 | $108,364 | $76,196 |
| 2015 | $2,331 | $181,788 | $106,736 | $75,052 |
| 2014 | $2,256 | $178,228 | $104,646 | $73,582 |
Source: Public Records
Map
Nearby Homes
- 11219 Hood Way
- 7336 Ewell Way
- 7271 Katella Ave Unit 101
- 7271 Katella Ave Unit 99
- 18 Redwood Ct Unit 18
- 11058 Grant Way
- 10860 Jasmine Ln
- 7761 Davmor Ave
- 10748 Knott Ave
- 10684 Bell St
- 10720 Knott Ave
- 10756 Knott Ave
- 10550 Western Ave Unit 3
- 10550 Western Ave Unit 86
- 10550 Western Ave Unit 98
- 10550 Western Ave Unit 33
- 10550 Western Ave Unit 32
- 10550 Western Ave
- 10550 Western Ave Unit 128
- 10550 Western Ave Unit 29
- 11069 Radcliff Way
- 11065 Radcliff Way
- 11073 Radcliff Way
- 11061 Radcliff Way
- 11075 Radcliff Way
- 11072 Radcliff Way
- 11068 Radcliff Way
- 11064 Radcliff Way
- 7432 Ascot Way
- 11060 Radcliff Way
- 7424 Ascot Way
- 7446 Ascot Way
- 7412 Ascot Way
- 7400 Ascot Way
- 11058 Radcliff Way
- 11064 Camden Way
- 11066 Camden Way
- 11068 Camden Way
- 11056 Radcliff Way
- 11060 Camden Way
Your Personal Tour Guide
Ask me questions while you tour the home.