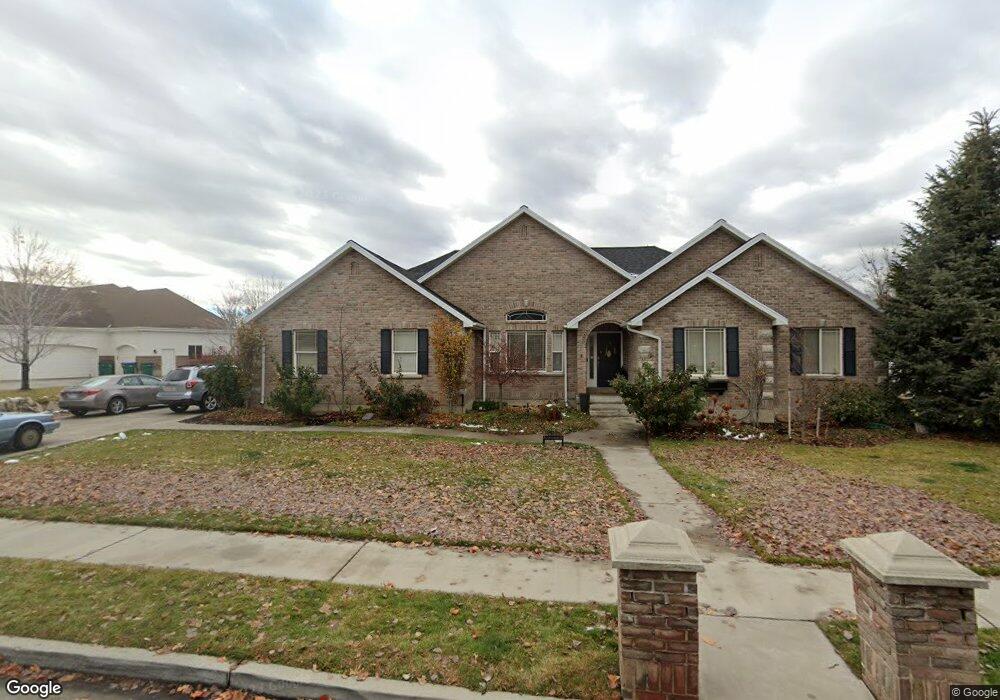
11069 N 5870 W Highland, UT 84003
Estimated Value: $970,192 - $1,153,000
2
Beds
2
Baths
2,146
Sq Ft
$481/Sq Ft
Est. Value
About This Home
This home is located at 11069 N 5870 W, Highland, UT 84003 and is currently estimated at $1,032,298, approximately $481 per square foot. 11069 N 5870 W is a home with nearby schools including Westfield School, Timberline Middle School, and Lone Peak High School.
Ownership History
Date
Name
Owned For
Owner Type
Purchase Details
Closed on
May 23, 2005
Sold by
Trost Stephan and Trost Jodi Q
Bought by
Thomas Adam D
Current Estimated Value
Home Financials for this Owner
Home Financials are based on the most recent Mortgage that was taken out on this home.
Original Mortgage
$270,400
Outstanding Balance
$96,126
Interest Rate
1%
Mortgage Type
Fannie Mae Freddie Mac
Estimated Equity
$936,172
Purchase Details
Closed on
Jan 23, 2003
Sold by
Trost Stephan C and Trost Jodi Q
Bought by
Trost Stephan and Trost Jodi Q
Home Financials for this Owner
Home Financials are based on the most recent Mortgage that was taken out on this home.
Original Mortgage
$276,000
Interest Rate
5.96%
Purchase Details
Closed on
May 24, 2000
Sold by
Rasmussen Bryce T
Bought by
Trost Stephan C and Trost Jodi Q
Home Financials for this Owner
Home Financials are based on the most recent Mortgage that was taken out on this home.
Original Mortgage
$244,000
Interest Rate
8.08%
Purchase Details
Closed on
Oct 29, 1999
Sold by
Avonmore Development Lc
Bought by
Rasmussen Bryce T
Create a Home Valuation Report for This Property
The Home Valuation Report is an in-depth analysis detailing your home's value as well as a comparison with similar homes in the area
Home Values in the Area
Average Home Value in this Area
Purchase History
| Date | Buyer | Sale Price | Title Company |
|---|---|---|---|
| Thomas Adam D | -- | Access Title Company | |
| Trost Stephan | -- | Meridian Title | |
| Trost Stephan C | -- | Equity Title Agency Inc | |
| Rasmussen Bryce T | -- | Equity Title Agency Inc |
Source: Public Records
Mortgage History
| Date | Status | Borrower | Loan Amount |
|---|---|---|---|
| Open | Thomas Adam D | $270,400 | |
| Previous Owner | Trost Stephan | $276,000 | |
| Previous Owner | Trost Stephan C | $244,000 |
Source: Public Records
Tax History Compared to Growth
Tax History
| Year | Tax Paid | Tax Assessment Tax Assessment Total Assessment is a certain percentage of the fair market value that is determined by local assessors to be the total taxable value of land and additions on the property. | Land | Improvement |
|---|---|---|---|---|
| 2025 | $4,162 | $536,085 | $632,300 | $342,400 |
| 2024 | $4,162 | $514,140 | $0 | $0 |
| 2023 | $3,849 | $512,820 | $0 | $0 |
| 2022 | $3,994 | $516,010 | $0 | $0 |
| 2021 | $3,125 | $601,300 | $318,800 | $282,500 |
| 2020 | $2,922 | $551,500 | $277,200 | $274,300 |
| 2019 | $2,628 | $518,800 | $244,500 | $274,300 |
| 2018 | $2,765 | $518,800 | $244,500 | $274,300 |
| 2017 | $2,670 | $267,355 | $0 | $0 |
| 2016 | $2,930 | $274,285 | $0 | $0 |
| 2015 | $2,890 | $256,355 | $0 | $0 |
| 2014 | $2,615 | $229,955 | $0 | $0 |
Source: Public Records
Map
Nearby Homes
- 11124 N 6000 W
- 11248 Hawkstone Way Unit 109
- 6024 Hawkstone Way Unit 108
- 11228 Hawkstone Way Unit 110
- 10818 N 6000 W
- 5798 W 11350 N
- 5983 W 11270 N Unit 4
- 5976 W 11270 N Unit 5
- 5538 W Turin Ln
- 5538 W Naples Dr Unit 125
- 10925 N Marsala Dr
- 5509 W Sicily Ln
- 10905 N Vercelli Dr
- 6271 W 10830 St N
- 10763 N Dosh Ln
- 5377 W Evergreen Way
- Villa A Plan at TEN700
- Villa D Plan at TEN700
- Cottonwood Villa Plan at TEN700
- Villa C Plan at TEN700
- 11089 N 5870 W
- 11035 Avonmore Dr
- 11104 Avonmore Dr Unit 8
- 11072 Avonmore Dr Unit 7
- 11127 Avonmore Dr Unit 6
- 11107 Avonmore Dr Unit 5
- 11035 Avonmore Dr Unit 2
- 11089 Avonmore Dr Unit 4
- 11035 N 5870 W
- 11072 Avonmore Cir
- 11107 N 5870 W
- 5858 W Avonmore Cir
- 5858 W Avonmore Cir
- 5843 W Avonmore Cir Unit 10
- 5843 W Avonmore Cir
- 5843 Avonmore Cir
- 5902 W 11000 N Unit .70
- 5902 W 11000 N Unit 2
- 5902 W 11000 N
- 5888 Avonmore Cir