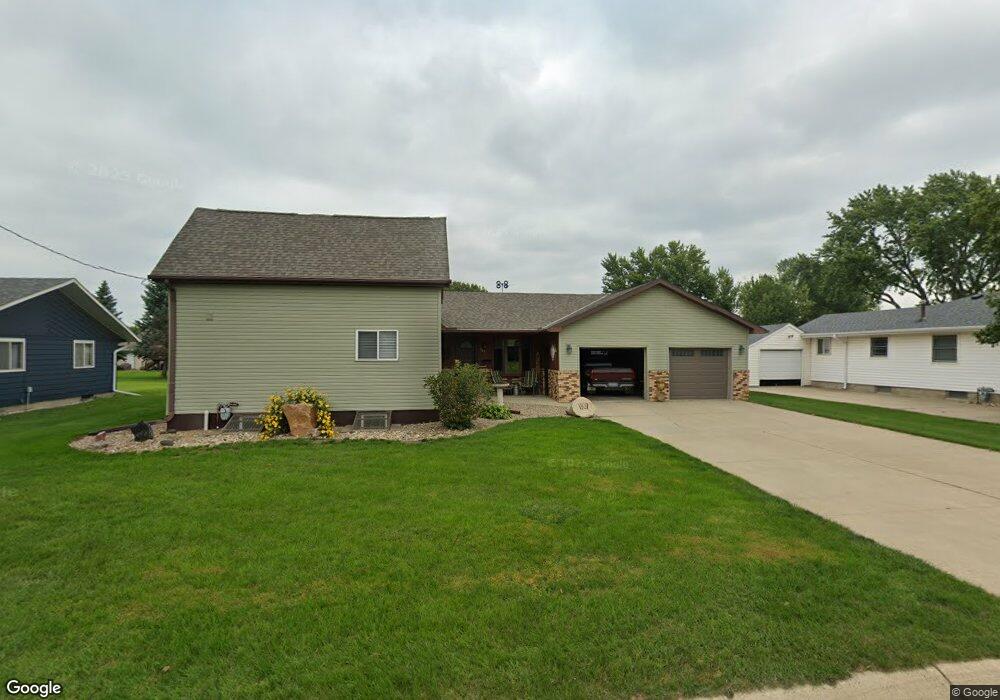
1107 12th St Rock Valley, IA 51247
Estimated Value: $165,000 - $260,000
--
Bed
--
Bath
1,541
Sq Ft
$146/Sq Ft
Est. Value
About This Home
This home is located at 1107 12th St, Rock Valley, IA 51247 and is currently estimated at $225,557, approximately $146 per square foot. 1107 12th St is a home located in Sioux County with nearby schools including Rock Valley Elementary School, Rock Valley Middle School, and Rock Valley Junior/Senior High School.
Ownership History
Date
Name
Owned For
Owner Type
Purchase Details
Closed on
Jul 26, 2016
Sold by
Malenosky Joshua D and Malenosky Megan J
Bought by
Vanden Top Gerrit and Van Den Top Irene W
Current Estimated Value
Purchase Details
Closed on
Apr 18, 2012
Sold by
Vanden Top Derek and Vanden Van Den
Bought by
Malenosky Joshua D and Malenosky Megan J
Home Financials for this Owner
Home Financials are based on the most recent Mortgage that was taken out on this home.
Original Mortgage
$138,700
Interest Rate
4.08%
Mortgage Type
New Conventional
Purchase Details
Closed on
Nov 13, 2008
Sold by
Vander Brink Amy S and Van Der Brink Benjamin L
Bought by
Den Top Derek Van and Den Top Anna M Van
Home Financials for this Owner
Home Financials are based on the most recent Mortgage that was taken out on this home.
Original Mortgage
$129,200
Interest Rate
6.09%
Mortgage Type
New Conventional
Create a Home Valuation Report for This Property
The Home Valuation Report is an in-depth analysis detailing your home's value as well as a comparison with similar homes in the area
Home Values in the Area
Average Home Value in this Area
Purchase History
| Date | Buyer | Sale Price | Title Company |
|---|---|---|---|
| Vanden Top Gerrit | -- | None Available | |
| Malenosky Joshua D | $146,000 | None Available | |
| Den Top Derek Van | $136,000 | None Available |
Source: Public Records
Mortgage History
| Date | Status | Borrower | Loan Amount |
|---|---|---|---|
| Previous Owner | Malenosky Joshua D | $138,700 | |
| Previous Owner | Den Top Derek Van | $129,200 |
Source: Public Records
Tax History Compared to Growth
Tax History
| Year | Tax Paid | Tax Assessment Tax Assessment Total Assessment is a certain percentage of the fair market value that is determined by local assessors to be the total taxable value of land and additions on the property. | Land | Improvement |
|---|---|---|---|---|
| 2025 | $3,026 | $239,400 | $28,330 | $211,070 |
| 2024 | $3,026 | $206,360 | $28,330 | $178,030 |
| 2023 | $3,064 | $206,360 | $28,330 | $178,030 |
| 2022 | $2,750 | $173,890 | $28,330 | $145,560 |
| 2021 | $2,924 | $173,310 | $28,330 | $144,980 |
| 2020 | $2,924 | $165,120 | $28,330 | $136,790 |
| 2019 | $2,772 | $153,320 | $18,030 | $135,290 |
| 2018 | $2,714 | $153,320 | $18,030 | $135,290 |
| 2017 | $2,714 | $153,320 | $18,030 | $135,290 |
| 2014 | $2,266 | $128,400 | $0 | $0 |
Source: Public Records
Map
Nearby Homes